All these main catalysts are contributing to a tight supply-demand balance for copper, leading to higher prices and potential shortages in the next years as the falling supply won’t be able to match soaring demand.
The supporting catalysts for copper prices continue at the stockpile front as well, with stockpiles holing by metal exchanges remaining low after a year when copper production was hit by energy shortages in Europe and China.
All these main catalysts are contributing to a tight supply-demand balance for copper, leading to higher prices and potential shortages in the next years as the falling supply won’t be able to match soaring demand.
Low copper inventories:
The supporting catalysts for copper prices continue at the stockpile front as well, with stockpiles holing by metal exchanges remaining low after a year when copper production was hit by energy shortages in Europe and China.
All these main catalysts are contributing to a tight supply-demand balance for copper, leading to higher prices and potential shortages in the next years as the falling supply won’t be able to match soaring demand.
The supply problem is worsened as many of the easily accessible copper deposits have already been mined around the world, while there have been several supply chain disruptions last year due to military and geopolitical instability (Ukraine war, Russian sanctions) or natural disasters in countries that are the major producers of copper (Chile, Kongo, Zambia).
Low copper inventories:
The supporting catalysts for copper prices continue at the stockpile front as well, with stockpiles holing by metal exchanges remaining low after a year when copper production was hit by energy shortages in Europe and China.
All these main catalysts are contributing to a tight supply-demand balance for copper, leading to higher prices and potential shortages in the next years as the falling supply won’t be able to match soaring demand.
Overall, the global smelting activity for 2022 fell to its lowest level in the six-year history of data from SAVANT, the satellite analytics service Marex launched with Earth-I, tightening further the copper market.
The supply problem is worsened as many of the easily accessible copper deposits have already been mined around the world, while there have been several supply chain disruptions last year due to military and geopolitical instability (Ukraine war, Russian sanctions) or natural disasters in countries that are the major producers of copper (Chile, Kongo, Zambia).
Low copper inventories:
The supporting catalysts for copper prices continue at the stockpile front as well, with stockpiles holing by metal exchanges remaining low after a year when copper production was hit by energy shortages in Europe and China.
All these main catalysts are contributing to a tight supply-demand balance for copper, leading to higher prices and potential shortages in the next years as the falling supply won’t be able to match soaring demand.
On the supply side, prices were pushed further after news that the global copper smelting activity-especially in China and Chile- dipped in December as smelters shut for maintenance after a year of slow activity.
Overall, the global smelting activity for 2022 fell to its lowest level in the six-year history of data from SAVANT, the satellite analytics service Marex launched with Earth-I, tightening further the copper market.
The supply problem is worsened as many of the easily accessible copper deposits have already been mined around the world, while there have been several supply chain disruptions last year due to military and geopolitical instability (Ukraine war, Russian sanctions) or natural disasters in countries that are the major producers of copper (Chile, Kongo, Zambia).
Low copper inventories:
The supporting catalysts for copper prices continue at the stockpile front as well, with stockpiles holing by metal exchanges remaining low after a year when copper production was hit by energy shortages in Europe and China.
All these main catalysts are contributing to a tight supply-demand balance for copper, leading to higher prices and potential shortages in the next years as the falling supply won’t be able to match soaring demand.
Tight supplies:
On the supply side, prices were pushed further after news that the global copper smelting activity-especially in China and Chile- dipped in December as smelters shut for maintenance after a year of slow activity.
Overall, the global smelting activity for 2022 fell to its lowest level in the six-year history of data from SAVANT, the satellite analytics service Marex launched with Earth-I, tightening further the copper market.
The supply problem is worsened as many of the easily accessible copper deposits have already been mined around the world, while there have been several supply chain disruptions last year due to military and geopolitical instability (Ukraine war, Russian sanctions) or natural disasters in countries that are the major producers of copper (Chile, Kongo, Zambia).
Low copper inventories:
The supporting catalysts for copper prices continue at the stockpile front as well, with stockpiles holing by metal exchanges remaining low after a year when copper production was hit by energy shortages in Europe and China.
All these main catalysts are contributing to a tight supply-demand balance for copper, leading to higher prices and potential shortages in the next years as the falling supply won’t be able to match soaring demand.
Hence, the demand for copper is soaring amid the green transition, as metal is one of the main components for EV batteries and other renewable technologies.
Tight supplies:
On the supply side, prices were pushed further after news that the global copper smelting activity-especially in China and Chile- dipped in December as smelters shut for maintenance after a year of slow activity.
Overall, the global smelting activity for 2022 fell to its lowest level in the six-year history of data from SAVANT, the satellite analytics service Marex launched with Earth-I, tightening further the copper market.
The supply problem is worsened as many of the easily accessible copper deposits have already been mined around the world, while there have been several supply chain disruptions last year due to military and geopolitical instability (Ukraine war, Russian sanctions) or natural disasters in countries that are the major producers of copper (Chile, Kongo, Zambia).
Low copper inventories:
The supporting catalysts for copper prices continue at the stockpile front as well, with stockpiles holing by metal exchanges remaining low after a year when copper production was hit by energy shortages in Europe and China.
All these main catalysts are contributing to a tight supply-demand balance for copper, leading to higher prices and potential shortages in the next years as the falling supply won’t be able to match soaring demand.
China is the world’s largest consumer of copper and the resurgence of industrial activity in the country will lift the demand for the red metal at a time when the copper market is experiencing tight supplies, and mining is becoming increasingly difficult and expensive due to the rising operational costs (fuel and raw materials).
Hence, the demand for copper is soaring amid the green transition, as metal is one of the main components for EV batteries and other renewable technologies.
Tight supplies:
On the supply side, prices were pushed further after news that the global copper smelting activity-especially in China and Chile- dipped in December as smelters shut for maintenance after a year of slow activity.
Overall, the global smelting activity for 2022 fell to its lowest level in the six-year history of data from SAVANT, the satellite analytics service Marex launched with Earth-I, tightening further the copper market.
The supply problem is worsened as many of the easily accessible copper deposits have already been mined around the world, while there have been several supply chain disruptions last year due to military and geopolitical instability (Ukraine war, Russian sanctions) or natural disasters in countries that are the major producers of copper (Chile, Kongo, Zambia).
Low copper inventories:
The supporting catalysts for copper prices continue at the stockpile front as well, with stockpiles holing by metal exchanges remaining low after a year when copper production was hit by energy shortages in Europe and China.
All these main catalysts are contributing to a tight supply-demand balance for copper, leading to higher prices and potential shortages in the next years as the falling supply won’t be able to match soaring demand.
According to Chinese state media CCTV, the southern manufacturing hub of Guangzhou plans 1,722 projects in 2023 worth nearly $1 trillion, lifting demand for copper throughout the year.
China is the world’s largest consumer of copper and the resurgence of industrial activity in the country will lift the demand for the red metal at a time when the copper market is experiencing tight supplies, and mining is becoming increasingly difficult and expensive due to the rising operational costs (fuel and raw materials).
Hence, the demand for copper is soaring amid the green transition, as metal is one of the main components for EV batteries and other renewable technologies.
Tight supplies:
On the supply side, prices were pushed further after news that the global copper smelting activity-especially in China and Chile- dipped in December as smelters shut for maintenance after a year of slow activity.
Overall, the global smelting activity for 2022 fell to its lowest level in the six-year history of data from SAVANT, the satellite analytics service Marex launched with Earth-I, tightening further the copper market.
The supply problem is worsened as many of the easily accessible copper deposits have already been mined around the world, while there have been several supply chain disruptions last year due to military and geopolitical instability (Ukraine war, Russian sanctions) or natural disasters in countries that are the major producers of copper (Chile, Kongo, Zambia).
Low copper inventories:
The supporting catalysts for copper prices continue at the stockpile front as well, with stockpiles holing by metal exchanges remaining low after a year when copper production was hit by energy shortages in Europe and China.
All these main catalysts are contributing to a tight supply-demand balance for copper, leading to higher prices and potential shortages in the next years as the falling supply won’t be able to match soaring demand.
Metal traders turned bullish on copper in late December 2022, as they believe that Chinese demand for industrial metals will rebound after the country eased most of its anti-Covid measures, improving the demand growth outlook for copper.
According to Chinese state media CCTV, the southern manufacturing hub of Guangzhou plans 1,722 projects in 2023 worth nearly $1 trillion, lifting demand for copper throughout the year.
China is the world’s largest consumer of copper and the resurgence of industrial activity in the country will lift the demand for the red metal at a time when the copper market is experiencing tight supplies, and mining is becoming increasingly difficult and expensive due to the rising operational costs (fuel and raw materials).
Hence, the demand for copper is soaring amid the green transition, as metal is one of the main components for EV batteries and other renewable technologies.
Tight supplies:
On the supply side, prices were pushed further after news that the global copper smelting activity-especially in China and Chile- dipped in December as smelters shut for maintenance after a year of slow activity.
Overall, the global smelting activity for 2022 fell to its lowest level in the six-year history of data from SAVANT, the satellite analytics service Marex launched with Earth-I, tightening further the copper market.
The supply problem is worsened as many of the easily accessible copper deposits have already been mined around the world, while there have been several supply chain disruptions last year due to military and geopolitical instability (Ukraine war, Russian sanctions) or natural disasters in countries that are the major producers of copper (Chile, Kongo, Zambia).
Low copper inventories:
The supporting catalysts for copper prices continue at the stockpile front as well, with stockpiles holing by metal exchanges remaining low after a year when copper production was hit by energy shortages in Europe and China.
All these main catalysts are contributing to a tight supply-demand balance for copper, leading to higher prices and potential shortages in the next years as the falling supply won’t be able to match soaring demand.
Robust demand for copper:
Metal traders turned bullish on copper in late December 2022, as they believe that Chinese demand for industrial metals will rebound after the country eased most of its anti-Covid measures, improving the demand growth outlook for copper.
According to Chinese state media CCTV, the southern manufacturing hub of Guangzhou plans 1,722 projects in 2023 worth nearly $1 trillion, lifting demand for copper throughout the year.
China is the world’s largest consumer of copper and the resurgence of industrial activity in the country will lift the demand for the red metal at a time when the copper market is experiencing tight supplies, and mining is becoming increasingly difficult and expensive due to the rising operational costs (fuel and raw materials).
Hence, the demand for copper is soaring amid the green transition, as metal is one of the main components for EV batteries and other renewable technologies.
Tight supplies:
On the supply side, prices were pushed further after news that the global copper smelting activity-especially in China and Chile- dipped in December as smelters shut for maintenance after a year of slow activity.
Overall, the global smelting activity for 2022 fell to its lowest level in the six-year history of data from SAVANT, the satellite analytics service Marex launched with Earth-I, tightening further the copper market.
The supply problem is worsened as many of the easily accessible copper deposits have already been mined around the world, while there have been several supply chain disruptions last year due to military and geopolitical instability (Ukraine war, Russian sanctions) or natural disasters in countries that are the major producers of copper (Chile, Kongo, Zambia).
Low copper inventories:
The supporting catalysts for copper prices continue at the stockpile front as well, with stockpiles holing by metal exchanges remaining low after a year when copper production was hit by energy shortages in Europe and China.
All these main catalysts are contributing to a tight supply-demand balance for copper, leading to higher prices and potential shortages in the next years as the falling supply won’t be able to match soaring demand.
Dollar-denominated copper also receives support from the softer U.S. dollar, which has slid to near a seven-month low against major peers as forex traders see the Federal Reserve turning less hawkish after cooler inflation and employment data.
Robust demand for copper:
Metal traders turned bullish on copper in late December 2022, as they believe that Chinese demand for industrial metals will rebound after the country eased most of its anti-Covid measures, improving the demand growth outlook for copper.
According to Chinese state media CCTV, the southern manufacturing hub of Guangzhou plans 1,722 projects in 2023 worth nearly $1 trillion, lifting demand for copper throughout the year.
China is the world’s largest consumer of copper and the resurgence of industrial activity in the country will lift the demand for the red metal at a time when the copper market is experiencing tight supplies, and mining is becoming increasingly difficult and expensive due to the rising operational costs (fuel and raw materials).
Hence, the demand for copper is soaring amid the green transition, as metal is one of the main components for EV batteries and other renewable technologies.
Tight supplies:
On the supply side, prices were pushed further after news that the global copper smelting activity-especially in China and Chile- dipped in December as smelters shut for maintenance after a year of slow activity.
Overall, the global smelting activity for 2022 fell to its lowest level in the six-year history of data from SAVANT, the satellite analytics service Marex launched with Earth-I, tightening further the copper market.
The supply problem is worsened as many of the easily accessible copper deposits have already been mined around the world, while there have been several supply chain disruptions last year due to military and geopolitical instability (Ukraine war, Russian sanctions) or natural disasters in countries that are the major producers of copper (Chile, Kongo, Zambia).
Low copper inventories:
The supporting catalysts for copper prices continue at the stockpile front as well, with stockpiles holing by metal exchanges remaining low after a year when copper production was hit by energy shortages in Europe and China.
All these main catalysts are contributing to a tight supply-demand balance for copper, leading to higher prices and potential shortages in the next years as the falling supply won’t be able to match soaring demand.
The China-led large-scale optimism on the metal market has pushed copper prices as high as $4.17 per pound, or $9,18 per tonne on Wednesday, recording their highest levels since mid-June 2022, despite the growing concerns about rising covid-19 cases in China and weakening global manufacturing and construction activity.
Dollar-denominated copper also receives support from the softer U.S. dollar, which has slid to near a seven-month low against major peers as forex traders see the Federal Reserve turning less hawkish after cooler inflation and employment data.
Robust demand for copper:
Metal traders turned bullish on copper in late December 2022, as they believe that Chinese demand for industrial metals will rebound after the country eased most of its anti-Covid measures, improving the demand growth outlook for copper.
According to Chinese state media CCTV, the southern manufacturing hub of Guangzhou plans 1,722 projects in 2023 worth nearly $1 trillion, lifting demand for copper throughout the year.
China is the world’s largest consumer of copper and the resurgence of industrial activity in the country will lift the demand for the red metal at a time when the copper market is experiencing tight supplies, and mining is becoming increasingly difficult and expensive due to the rising operational costs (fuel and raw materials).
Hence, the demand for copper is soaring amid the green transition, as metal is one of the main components for EV batteries and other renewable technologies.
Tight supplies:
On the supply side, prices were pushed further after news that the global copper smelting activity-especially in China and Chile- dipped in December as smelters shut for maintenance after a year of slow activity.
Overall, the global smelting activity for 2022 fell to its lowest level in the six-year history of data from SAVANT, the satellite analytics service Marex launched with Earth-I, tightening further the copper market.
The supply problem is worsened as many of the easily accessible copper deposits have already been mined around the world, while there have been several supply chain disruptions last year due to military and geopolitical instability (Ukraine war, Russian sanctions) or natural disasters in countries that are the major producers of copper (Chile, Kongo, Zambia).
Low copper inventories:
The supporting catalysts for copper prices continue at the stockpile front as well, with stockpiles holing by metal exchanges remaining low after a year when copper production was hit by energy shortages in Europe and China.
All these main catalysts are contributing to a tight supply-demand balance for copper, leading to higher prices and potential shortages in the next years as the falling supply won’t be able to match soaring demand.
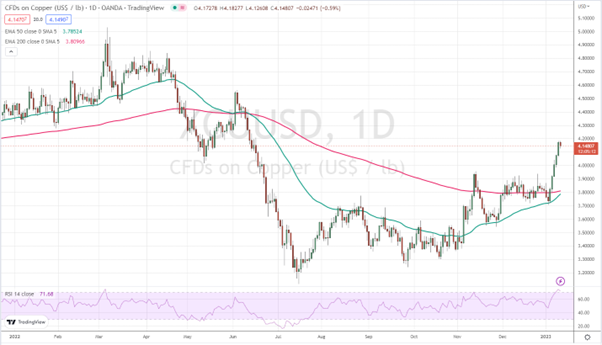
Copper price, Daily chart
The China-led large-scale optimism on the metal market has pushed copper prices as high as $4.17 per pound, or $9,18 per tonne on Wednesday, recording their highest levels since mid-June 2022, despite the growing concerns about rising covid-19 cases in China and weakening global manufacturing and construction activity.
Dollar-denominated copper also receives support from the softer U.S. dollar, which has slid to near a seven-month low against major peers as forex traders see the Federal Reserve turning less hawkish after cooler inflation and employment data.
Robust demand for copper:
Metal traders turned bullish on copper in late December 2022, as they believe that Chinese demand for industrial metals will rebound after the country eased most of its anti-Covid measures, improving the demand growth outlook for copper.
According to Chinese state media CCTV, the southern manufacturing hub of Guangzhou plans 1,722 projects in 2023 worth nearly $1 trillion, lifting demand for copper throughout the year.
China is the world’s largest consumer of copper and the resurgence of industrial activity in the country will lift the demand for the red metal at a time when the copper market is experiencing tight supplies, and mining is becoming increasingly difficult and expensive due to the rising operational costs (fuel and raw materials).
Hence, the demand for copper is soaring amid the green transition, as metal is one of the main components for EV batteries and other renewable technologies.
Tight supplies:
On the supply side, prices were pushed further after news that the global copper smelting activity-especially in China and Chile- dipped in December as smelters shut for maintenance after a year of slow activity.
Overall, the global smelting activity for 2022 fell to its lowest level in the six-year history of data from SAVANT, the satellite analytics service Marex launched with Earth-I, tightening further the copper market.
The supply problem is worsened as many of the easily accessible copper deposits have already been mined around the world, while there have been several supply chain disruptions last year due to military and geopolitical instability (Ukraine war, Russian sanctions) or natural disasters in countries that are the major producers of copper (Chile, Kongo, Zambia).
Low copper inventories:
The supporting catalysts for copper prices continue at the stockpile front as well, with stockpiles holing by metal exchanges remaining low after a year when copper production was hit by energy shortages in Europe and China.
All these main catalysts are contributing to a tight supply-demand balance for copper, leading to higher prices and potential shortages in the next years as the falling supply won’t be able to match soaring demand.
China’s reopening optimism, the hopes for an economic rebound in China together with tight copper supplies, and low global inventories have been driving up the price of the red metal recently, gaining nearly 30% since July 2022.
Copper price, Daily chart
The China-led large-scale optimism on the metal market has pushed copper prices as high as $4.17 per pound, or $9,18 per tonne on Wednesday, recording their highest levels since mid-June 2022, despite the growing concerns about rising covid-19 cases in China and weakening global manufacturing and construction activity.
Dollar-denominated copper also receives support from the softer U.S. dollar, which has slid to near a seven-month low against major peers as forex traders see the Federal Reserve turning less hawkish after cooler inflation and employment data.
Robust demand for copper:
Metal traders turned bullish on copper in late December 2022, as they believe that Chinese demand for industrial metals will rebound after the country eased most of its anti-Covid measures, improving the demand growth outlook for copper.
According to Chinese state media CCTV, the southern manufacturing hub of Guangzhou plans 1,722 projects in 2023 worth nearly $1 trillion, lifting demand for copper throughout the year.
China is the world’s largest consumer of copper and the resurgence of industrial activity in the country will lift the demand for the red metal at a time when the copper market is experiencing tight supplies, and mining is becoming increasingly difficult and expensive due to the rising operational costs (fuel and raw materials).
Hence, the demand for copper is soaring amid the green transition, as metal is one of the main components for EV batteries and other renewable technologies.
Tight supplies:
On the supply side, prices were pushed further after news that the global copper smelting activity-especially in China and Chile- dipped in December as smelters shut for maintenance after a year of slow activity.
Overall, the global smelting activity for 2022 fell to its lowest level in the six-year history of data from SAVANT, the satellite analytics service Marex launched with Earth-I, tightening further the copper market.
The supply problem is worsened as many of the easily accessible copper deposits have already been mined around the world, while there have been several supply chain disruptions last year due to military and geopolitical instability (Ukraine war, Russian sanctions) or natural disasters in countries that are the major producers of copper (Chile, Kongo, Zambia).
Low copper inventories:
The supporting catalysts for copper prices continue at the stockpile front as well, with stockpiles holing by metal exchanges remaining low after a year when copper production was hit by energy shortages in Europe and China.
All these main catalysts are contributing to a tight supply-demand balance for copper, leading to higher prices and potential shortages in the next years as the falling supply won’t be able to match soaring demand.