Furthermore, investors have also moved some funds into the safety of the cryptocurrencies in the latest trading sessions to hedge their portfolio’s geopolitical and economic risk.
The potential approval of spot Bitcoin ETFs by the US Securities and Exchange Commission (SEC) is anticipated to revolutionize the crypto market, by connecting the traditional finance system with the digital world and enable real-time price analysis.
Furthermore, investors have also moved some funds into the safety of the cryptocurrencies in the latest trading sessions to hedge their portfolio’s geopolitical and economic risk.
BlackRock filed its application for a spot Bitcoin ETF in June, prompting a rush of similar filings from rival asset issuers such as Ark Invest and 21Shares, with the SEC deadline for approval being set at January 10, 2024.
The potential approval of spot Bitcoin ETFs by the US Securities and Exchange Commission (SEC) is anticipated to revolutionize the crypto market, by connecting the traditional finance system with the digital world and enable real-time price analysis.
Furthermore, investors have also moved some funds into the safety of the cryptocurrencies in the latest trading sessions to hedge their portfolio’s geopolitical and economic risk.
While the U.S. Securities and Exchange Commission has approved futures-based Bitcoin ETFs in the past, such products invest in derivatives and thus do not impact the supply of BTC. By contrast, a spot ETF would invest in Bitcoin directly, driving a potential shortage of Bitcoin’s supply.
BlackRock filed its application for a spot Bitcoin ETF in June, prompting a rush of similar filings from rival asset issuers such as Ark Invest and 21Shares, with the SEC deadline for approval being set at January 10, 2024.
The potential approval of spot Bitcoin ETFs by the US Securities and Exchange Commission (SEC) is anticipated to revolutionize the crypto market, by connecting the traditional finance system with the digital world and enable real-time price analysis.
Furthermore, investors have also moved some funds into the safety of the cryptocurrencies in the latest trading sessions to hedge their portfolio’s geopolitical and economic risk.
The Bitcoin ETF was also listed on the Depository Trust & Clearing Corporation, which clears trades executed on the NASDAQ exchange, which shows another step in the process of launching the ETF.
While the U.S. Securities and Exchange Commission has approved futures-based Bitcoin ETFs in the past, such products invest in derivatives and thus do not impact the supply of BTC. By contrast, a spot ETF would invest in Bitcoin directly, driving a potential shortage of Bitcoin’s supply.
BlackRock filed its application for a spot Bitcoin ETF in June, prompting a rush of similar filings from rival asset issuers such as Ark Invest and 21Shares, with the SEC deadline for approval being set at January 10, 2024.
The potential approval of spot Bitcoin ETFs by the US Securities and Exchange Commission (SEC) is anticipated to revolutionize the crypto market, by connecting the traditional finance system with the digital world and enable real-time price analysis.
Furthermore, investors have also moved some funds into the safety of the cryptocurrencies in the latest trading sessions to hedge their portfolio’s geopolitical and economic risk.
An updated BlackRock filing indicates the firm may move to seed its iShares Bitcoin Trust with cash this month and launch the fund soon. Seeding a Bitcoin ETF is when initial funding is provided to create the first units of Bitcoin in exchange for ETF shares which can be traded in the open market later.
The Bitcoin ETF was also listed on the Depository Trust & Clearing Corporation, which clears trades executed on the NASDAQ exchange, which shows another step in the process of launching the ETF.
While the U.S. Securities and Exchange Commission has approved futures-based Bitcoin ETFs in the past, such products invest in derivatives and thus do not impact the supply of BTC. By contrast, a spot ETF would invest in Bitcoin directly, driving a potential shortage of Bitcoin’s supply.
BlackRock filed its application for a spot Bitcoin ETF in June, prompting a rush of similar filings from rival asset issuers such as Ark Invest and 21Shares, with the SEC deadline for approval being set at January 10, 2024.
The potential approval of spot Bitcoin ETFs by the US Securities and Exchange Commission (SEC) is anticipated to revolutionize the crypto market, by connecting the traditional finance system with the digital world and enable real-time price analysis.
Furthermore, investors have also moved some funds into the safety of the cryptocurrencies in the latest trading sessions to hedge their portfolio’s geopolitical and economic risk.
What has triggered the current rally in the crypto ecosystem is that the highly anticipated spot Bitcoin exchange-traded fund from the world’s largest asset manager, BlackRock, may be seeded this month.
An updated BlackRock filing indicates the firm may move to seed its iShares Bitcoin Trust with cash this month and launch the fund soon. Seeding a Bitcoin ETF is when initial funding is provided to create the first units of Bitcoin in exchange for ETF shares which can be traded in the open market later.
The Bitcoin ETF was also listed on the Depository Trust & Clearing Corporation, which clears trades executed on the NASDAQ exchange, which shows another step in the process of launching the ETF.
While the U.S. Securities and Exchange Commission has approved futures-based Bitcoin ETFs in the past, such products invest in derivatives and thus do not impact the supply of BTC. By contrast, a spot ETF would invest in Bitcoin directly, driving a potential shortage of Bitcoin’s supply.
BlackRock filed its application for a spot Bitcoin ETF in June, prompting a rush of similar filings from rival asset issuers such as Ark Invest and 21Shares, with the SEC deadline for approval being set at January 10, 2024.
The potential approval of spot Bitcoin ETFs by the US Securities and Exchange Commission (SEC) is anticipated to revolutionize the crypto market, by connecting the traditional finance system with the digital world and enable real-time price analysis.
Furthermore, investors have also moved some funds into the safety of the cryptocurrencies in the latest trading sessions to hedge their portfolio’s geopolitical and economic risk.
Bullish Bitcoin ETF Progress:
What has triggered the current rally in the crypto ecosystem is that the highly anticipated spot Bitcoin exchange-traded fund from the world’s largest asset manager, BlackRock, may be seeded this month.
An updated BlackRock filing indicates the firm may move to seed its iShares Bitcoin Trust with cash this month and launch the fund soon. Seeding a Bitcoin ETF is when initial funding is provided to create the first units of Bitcoin in exchange for ETF shares which can be traded in the open market later.
The Bitcoin ETF was also listed on the Depository Trust & Clearing Corporation, which clears trades executed on the NASDAQ exchange, which shows another step in the process of launching the ETF.
While the U.S. Securities and Exchange Commission has approved futures-based Bitcoin ETFs in the past, such products invest in derivatives and thus do not impact the supply of BTC. By contrast, a spot ETF would invest in Bitcoin directly, driving a potential shortage of Bitcoin’s supply.
BlackRock filed its application for a spot Bitcoin ETF in June, prompting a rush of similar filings from rival asset issuers such as Ark Invest and 21Shares, with the SEC deadline for approval being set at January 10, 2024.
The potential approval of spot Bitcoin ETFs by the US Securities and Exchange Commission (SEC) is anticipated to revolutionize the crypto market, by connecting the traditional finance system with the digital world and enable real-time price analysis.
Furthermore, investors have also moved some funds into the safety of the cryptocurrencies in the latest trading sessions to hedge their portfolio’s geopolitical and economic risk.
The market cap of Bitcoin has grown to $670 million, Ethereum to $220 million, XRP to $29 million, Solana to $13 million, and Cardano to $10 million. The combined crypto market cap is now on the cusp of retesting April’s year-to-date high of $1.28T after sitting at $1.03T last month. https://coinmarketcap.com/
Bullish Bitcoin ETF Progress:
What has triggered the current rally in the crypto ecosystem is that the highly anticipated spot Bitcoin exchange-traded fund from the world’s largest asset manager, BlackRock, may be seeded this month.
An updated BlackRock filing indicates the firm may move to seed its iShares Bitcoin Trust with cash this month and launch the fund soon. Seeding a Bitcoin ETF is when initial funding is provided to create the first units of Bitcoin in exchange for ETF shares which can be traded in the open market later.
The Bitcoin ETF was also listed on the Depository Trust & Clearing Corporation, which clears trades executed on the NASDAQ exchange, which shows another step in the process of launching the ETF.
While the U.S. Securities and Exchange Commission has approved futures-based Bitcoin ETFs in the past, such products invest in derivatives and thus do not impact the supply of BTC. By contrast, a spot ETF would invest in Bitcoin directly, driving a potential shortage of Bitcoin’s supply.
BlackRock filed its application for a spot Bitcoin ETF in June, prompting a rush of similar filings from rival asset issuers such as Ark Invest and 21Shares, with the SEC deadline for approval being set at January 10, 2024.
The potential approval of spot Bitcoin ETFs by the US Securities and Exchange Commission (SEC) is anticipated to revolutionize the crypto market, by connecting the traditional finance system with the digital world and enable real-time price analysis.
Furthermore, investors have also moved some funds into the safety of the cryptocurrencies in the latest trading sessions to hedge their portfolio’s geopolitical and economic risk.
Other top 10 cryptocurrencies have also rallied by between 10%-20% over the same period, with Solana leading the gains by 30%, climbing up to $32, XRP by 12% to $0.55, and Cardano gaining 15% to $0.30.
The market cap of Bitcoin has grown to $670 million, Ethereum to $220 million, XRP to $29 million, Solana to $13 million, and Cardano to $10 million. The combined crypto market cap is now on the cusp of retesting April’s year-to-date high of $1.28T after sitting at $1.03T last month. https://coinmarketcap.com/
Bullish Bitcoin ETF Progress:
What has triggered the current rally in the crypto ecosystem is that the highly anticipated spot Bitcoin exchange-traded fund from the world’s largest asset manager, BlackRock, may be seeded this month.
An updated BlackRock filing indicates the firm may move to seed its iShares Bitcoin Trust with cash this month and launch the fund soon. Seeding a Bitcoin ETF is when initial funding is provided to create the first units of Bitcoin in exchange for ETF shares which can be traded in the open market later.
The Bitcoin ETF was also listed on the Depository Trust & Clearing Corporation, which clears trades executed on the NASDAQ exchange, which shows another step in the process of launching the ETF.
While the U.S. Securities and Exchange Commission has approved futures-based Bitcoin ETFs in the past, such products invest in derivatives and thus do not impact the supply of BTC. By contrast, a spot ETF would invest in Bitcoin directly, driving a potential shortage of Bitcoin’s supply.
BlackRock filed its application for a spot Bitcoin ETF in June, prompting a rush of similar filings from rival asset issuers such as Ark Invest and 21Shares, with the SEC deadline for approval being set at January 10, 2024.
The potential approval of spot Bitcoin ETFs by the US Securities and Exchange Commission (SEC) is anticipated to revolutionize the crypto market, by connecting the traditional finance system with the digital world and enable real-time price analysis.
Furthermore, investors have also moved some funds into the safety of the cryptocurrencies in the latest trading sessions to hedge their portfolio’s geopolitical and economic risk.
Both Bitcoin and Ethereum have also posted a nearly 110% and 55% price increase respectively since the start of 2023, where they were trading at nearly $16.500 and $1,200.
Other top 10 cryptocurrencies have also rallied by between 10%-20% over the same period, with Solana leading the gains by 30%, climbing up to $32, XRP by 12% to $0.55, and Cardano gaining 15% to $0.30.
The market cap of Bitcoin has grown to $670 million, Ethereum to $220 million, XRP to $29 million, Solana to $13 million, and Cardano to $10 million. The combined crypto market cap is now on the cusp of retesting April’s year-to-date high of $1.28T after sitting at $1.03T last month. https://coinmarketcap.com/
Bullish Bitcoin ETF Progress:
What has triggered the current rally in the crypto ecosystem is that the highly anticipated spot Bitcoin exchange-traded fund from the world’s largest asset manager, BlackRock, may be seeded this month.
An updated BlackRock filing indicates the firm may move to seed its iShares Bitcoin Trust with cash this month and launch the fund soon. Seeding a Bitcoin ETF is when initial funding is provided to create the first units of Bitcoin in exchange for ETF shares which can be traded in the open market later.
The Bitcoin ETF was also listed on the Depository Trust & Clearing Corporation, which clears trades executed on the NASDAQ exchange, which shows another step in the process of launching the ETF.
While the U.S. Securities and Exchange Commission has approved futures-based Bitcoin ETFs in the past, such products invest in derivatives and thus do not impact the supply of BTC. By contrast, a spot ETF would invest in Bitcoin directly, driving a potential shortage of Bitcoin’s supply.
BlackRock filed its application for a spot Bitcoin ETF in June, prompting a rush of similar filings from rival asset issuers such as Ark Invest and 21Shares, with the SEC deadline for approval being set at January 10, 2024.
The potential approval of spot Bitcoin ETFs by the US Securities and Exchange Commission (SEC) is anticipated to revolutionize the crypto market, by connecting the traditional finance system with the digital world and enable real-time price analysis.
Furthermore, investors have also moved some funds into the safety of the cryptocurrencies in the latest trading sessions to hedge their portfolio’s geopolitical and economic risk.
Ethereum, the second-biggest digital coin, surged to its highest since August 2023, hovering at around $1,850, also adding $300 or almost 20% gains since mid-October.
Both Bitcoin and Ethereum have also posted a nearly 110% and 55% price increase respectively since the start of 2023, where they were trading at nearly $16.500 and $1,200.
Other top 10 cryptocurrencies have also rallied by between 10%-20% over the same period, with Solana leading the gains by 30%, climbing up to $32, XRP by 12% to $0.55, and Cardano gaining 15% to $0.30.
The market cap of Bitcoin has grown to $670 million, Ethereum to $220 million, XRP to $29 million, Solana to $13 million, and Cardano to $10 million. The combined crypto market cap is now on the cusp of retesting April’s year-to-date high of $1.28T after sitting at $1.03T last month. https://coinmarketcap.com/
Bullish Bitcoin ETF Progress:
What has triggered the current rally in the crypto ecosystem is that the highly anticipated spot Bitcoin exchange-traded fund from the world’s largest asset manager, BlackRock, may be seeded this month.
An updated BlackRock filing indicates the firm may move to seed its iShares Bitcoin Trust with cash this month and launch the fund soon. Seeding a Bitcoin ETF is when initial funding is provided to create the first units of Bitcoin in exchange for ETF shares which can be traded in the open market later.
The Bitcoin ETF was also listed on the Depository Trust & Clearing Corporation, which clears trades executed on the NASDAQ exchange, which shows another step in the process of launching the ETF.
While the U.S. Securities and Exchange Commission has approved futures-based Bitcoin ETFs in the past, such products invest in derivatives and thus do not impact the supply of BTC. By contrast, a spot ETF would invest in Bitcoin directly, driving a potential shortage of Bitcoin’s supply.
BlackRock filed its application for a spot Bitcoin ETF in June, prompting a rush of similar filings from rival asset issuers such as Ark Invest and 21Shares, with the SEC deadline for approval being set at January 10, 2024.
The potential approval of spot Bitcoin ETFs by the US Securities and Exchange Commission (SEC) is anticipated to revolutionize the crypto market, by connecting the traditional finance system with the digital world and enable real-time price analysis.
Furthermore, investors have also moved some funds into the safety of the cryptocurrencies in the latest trading sessions to hedge their portfolio’s geopolitical and economic risk.
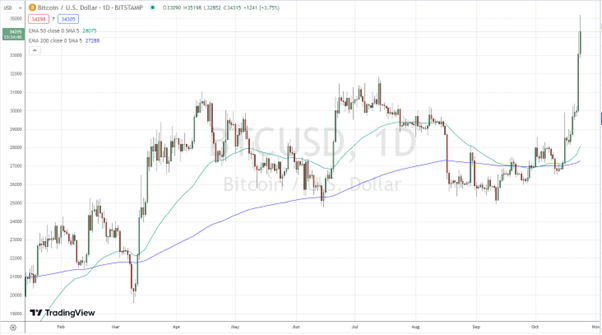
BTC/USD, Daily chart
Ethereum, the second-biggest digital coin, surged to its highest since August 2023, hovering at around $1,850, also adding $300 or almost 20% gains since mid-October.
Both Bitcoin and Ethereum have also posted a nearly 110% and 55% price increase respectively since the start of 2023, where they were trading at nearly $16.500 and $1,200.
Other top 10 cryptocurrencies have also rallied by between 10%-20% over the same period, with Solana leading the gains by 30%, climbing up to $32, XRP by 12% to $0.55, and Cardano gaining 15% to $0.30.
The market cap of Bitcoin has grown to $670 million, Ethereum to $220 million, XRP to $29 million, Solana to $13 million, and Cardano to $10 million. The combined crypto market cap is now on the cusp of retesting April’s year-to-date high of $1.28T after sitting at $1.03T last month. https://coinmarketcap.com/
Bullish Bitcoin ETF Progress:
What has triggered the current rally in the crypto ecosystem is that the highly anticipated spot Bitcoin exchange-traded fund from the world’s largest asset manager, BlackRock, may be seeded this month.
An updated BlackRock filing indicates the firm may move to seed its iShares Bitcoin Trust with cash this month and launch the fund soon. Seeding a Bitcoin ETF is when initial funding is provided to create the first units of Bitcoin in exchange for ETF shares which can be traded in the open market later.
The Bitcoin ETF was also listed on the Depository Trust & Clearing Corporation, which clears trades executed on the NASDAQ exchange, which shows another step in the process of launching the ETF.
While the U.S. Securities and Exchange Commission has approved futures-based Bitcoin ETFs in the past, such products invest in derivatives and thus do not impact the supply of BTC. By contrast, a spot ETF would invest in Bitcoin directly, driving a potential shortage of Bitcoin’s supply.
BlackRock filed its application for a spot Bitcoin ETF in June, prompting a rush of similar filings from rival asset issuers such as Ark Invest and 21Shares, with the SEC deadline for approval being set at January 10, 2024.
The potential approval of spot Bitcoin ETFs by the US Securities and Exchange Commission (SEC) is anticipated to revolutionize the crypto market, by connecting the traditional finance system with the digital world and enable real-time price analysis.
Furthermore, investors have also moved some funds into the safety of the cryptocurrencies in the latest trading sessions to hedge their portfolio’s geopolitical and economic risk.
Investment sentiment has improved in the crypto ecosystem since mid-October, with the world’s largest cryptocurrency Bitcoin rallying from the monthly lows of $26,000 up to May’s 2022 highs of $35,000 this morning, adding $9,000 or nearly 35% gains.
BTC/USD, Daily chart
Ethereum, the second-biggest digital coin, surged to its highest since August 2023, hovering at around $1,850, also adding $300 or almost 20% gains since mid-October.
Both Bitcoin and Ethereum have also posted a nearly 110% and 55% price increase respectively since the start of 2023, where they were trading at nearly $16.500 and $1,200.
Other top 10 cryptocurrencies have also rallied by between 10%-20% over the same period, with Solana leading the gains by 30%, climbing up to $32, XRP by 12% to $0.55, and Cardano gaining 15% to $0.30.
The market cap of Bitcoin has grown to $670 million, Ethereum to $220 million, XRP to $29 million, Solana to $13 million, and Cardano to $10 million. The combined crypto market cap is now on the cusp of retesting April’s year-to-date high of $1.28T after sitting at $1.03T last month. https://coinmarketcap.com/
Bullish Bitcoin ETF Progress:
What has triggered the current rally in the crypto ecosystem is that the highly anticipated spot Bitcoin exchange-traded fund from the world’s largest asset manager, BlackRock, may be seeded this month.
An updated BlackRock filing indicates the firm may move to seed its iShares Bitcoin Trust with cash this month and launch the fund soon. Seeding a Bitcoin ETF is when initial funding is provided to create the first units of Bitcoin in exchange for ETF shares which can be traded in the open market later.
The Bitcoin ETF was also listed on the Depository Trust & Clearing Corporation, which clears trades executed on the NASDAQ exchange, which shows another step in the process of launching the ETF.
While the U.S. Securities and Exchange Commission has approved futures-based Bitcoin ETFs in the past, such products invest in derivatives and thus do not impact the supply of BTC. By contrast, a spot ETF would invest in Bitcoin directly, driving a potential shortage of Bitcoin’s supply.
BlackRock filed its application for a spot Bitcoin ETF in June, prompting a rush of similar filings from rival asset issuers such as Ark Invest and 21Shares, with the SEC deadline for approval being set at January 10, 2024.
The potential approval of spot Bitcoin ETFs by the US Securities and Exchange Commission (SEC) is anticipated to revolutionize the crypto market, by connecting the traditional finance system with the digital world and enable real-time price analysis.
Furthermore, investors have also moved some funds into the safety of the cryptocurrencies in the latest trading sessions to hedge their portfolio’s geopolitical and economic risk.
Bitcoin climbed as high as $35,000 on Tuesday morning, rallying 15% in 24 hours, while Ethereum jumped up to $1,850, driven by the growing optimism around the possibility of the approval of the first Bitcoin ETF (exchange-traded fund) from the world’s largest asset manager, BlackRock.
Investment sentiment has improved in the crypto ecosystem since mid-October, with the world’s largest cryptocurrency Bitcoin rallying from the monthly lows of $26,000 up to May’s 2022 highs of $35,000 this morning, adding $9,000 or nearly 35% gains.
BTC/USD, Daily chart
Ethereum, the second-biggest digital coin, surged to its highest since August 2023, hovering at around $1,850, also adding $300 or almost 20% gains since mid-October.
Both Bitcoin and Ethereum have also posted a nearly 110% and 55% price increase respectively since the start of 2023, where they were trading at nearly $16.500 and $1,200.
Other top 10 cryptocurrencies have also rallied by between 10%-20% over the same period, with Solana leading the gains by 30%, climbing up to $32, XRP by 12% to $0.55, and Cardano gaining 15% to $0.30.
The market cap of Bitcoin has grown to $670 million, Ethereum to $220 million, XRP to $29 million, Solana to $13 million, and Cardano to $10 million. The combined crypto market cap is now on the cusp of retesting April’s year-to-date high of $1.28T after sitting at $1.03T last month. https://coinmarketcap.com/
Bullish Bitcoin ETF Progress:
What has triggered the current rally in the crypto ecosystem is that the highly anticipated spot Bitcoin exchange-traded fund from the world’s largest asset manager, BlackRock, may be seeded this month.
An updated BlackRock filing indicates the firm may move to seed its iShares Bitcoin Trust with cash this month and launch the fund soon. Seeding a Bitcoin ETF is when initial funding is provided to create the first units of Bitcoin in exchange for ETF shares which can be traded in the open market later.
The Bitcoin ETF was also listed on the Depository Trust & Clearing Corporation, which clears trades executed on the NASDAQ exchange, which shows another step in the process of launching the ETF.
While the U.S. Securities and Exchange Commission has approved futures-based Bitcoin ETFs in the past, such products invest in derivatives and thus do not impact the supply of BTC. By contrast, a spot ETF would invest in Bitcoin directly, driving a potential shortage of Bitcoin’s supply.
BlackRock filed its application for a spot Bitcoin ETF in June, prompting a rush of similar filings from rival asset issuers such as Ark Invest and 21Shares, with the SEC deadline for approval being set at January 10, 2024.
The potential approval of spot Bitcoin ETFs by the US Securities and Exchange Commission (SEC) is anticipated to revolutionize the crypto market, by connecting the traditional finance system with the digital world and enable real-time price analysis.
Furthermore, investors have also moved some funds into the safety of the cryptocurrencies in the latest trading sessions to hedge their portfolio’s geopolitical and economic risk.