Silver rallies to $24 on a banking turmoil and the supportive gold-silver ratio

Commodities investors are fleeing into silver due to its crucial role in the energy transition where its conductive qualities see it used in photovoltaics for solar energy and in the batteries of electric vehicles.

Commodities investors are fleeing into silver due to its crucial role in the energy transition where its conductive qualities see it used in photovoltaics for solar energy and in the batteries of electric vehicles.

The white metal is expected to have a growing demand from different industrial sectors – especially the photovoltaic and electric car batteries – which are expected to further boost its demand in the next few years on a global scale as part of the green transition and innovation.

Commodities investors are fleeing into silver due to its crucial role in the energy transition where its conductive qualities see it used in photovoltaics for solar energy and in the batteries of electric vehicles.

Silver in comparison to gold witch it enjoys a close safe-haven correlation from ancient times, it has also a strong demand for industrial usage since silver has been a key component in the energy transition and the technology revolution.

The white metal is expected to have a growing demand from different industrial sectors – especially the photovoltaic and electric car batteries – which are expected to further boost its demand in the next few years on a global scale as part of the green transition and innovation.

Commodities investors are fleeing into silver due to its crucial role in the energy transition where its conductive qualities see it used in photovoltaics for solar energy and in the batteries of electric vehicles.

Industrial demand:

Silver in comparison to gold witch it enjoys a close safe-haven correlation from ancient times, it has also a strong demand for industrial usage since silver has been a key component in the energy transition and the technology revolution.

The white metal is expected to have a growing demand from different industrial sectors – especially the photovoltaic and electric car batteries – which are expected to further boost its demand in the next few years on a global scale as part of the green transition and innovation.

Commodities investors are fleeing into silver due to its crucial role in the energy transition where its conductive qualities see it used in photovoltaics for solar energy and in the batteries of electric vehicles.

With the ratio being nearly 80 mark, it is clearly indicating the solid rebound of silver seen in the last two weeks of the banking crisis and its overperformance versus gold amid the combined haven and industrial demand.

Industrial demand:

Silver in comparison to gold witch it enjoys a close safe-haven correlation from ancient times, it has also a strong demand for industrial usage since silver has been a key component in the energy transition and the technology revolution.

The white metal is expected to have a growing demand from different industrial sectors – especially the photovoltaic and electric car batteries – which are expected to further boost its demand in the next few years on a global scale as part of the green transition and innovation.

Commodities investors are fleeing into silver due to its crucial role in the energy transition where its conductive qualities see it used in photovoltaics for solar energy and in the batteries of electric vehicles.

With the price of Gold currently at $1,980/oz and Silver at $24/oz, the ratio lies at 82.50 (1.980/24), which is much lower than the 91 traded in early March before the collapse of the two U.S. banks.

With the ratio being nearly 80 mark, it is clearly indicating the solid rebound of silver seen in the last two weeks of the banking crisis and its overperformance versus gold amid the combined haven and industrial demand.

Industrial demand:

Silver in comparison to gold witch it enjoys a close safe-haven correlation from ancient times, it has also a strong demand for industrial usage since silver has been a key component in the energy transition and the technology revolution.

The white metal is expected to have a growing demand from different industrial sectors – especially the photovoltaic and electric car batteries – which are expected to further boost its demand in the next few years on a global scale as part of the green transition and innovation.

Commodities investors are fleeing into silver due to its crucial role in the energy transition where its conductive qualities see it used in photovoltaics for solar energy and in the batteries of electric vehicles.

Another sign of the recent strength in the price of silver is the gold-silver ratio, which is analyzing the ratio between the two precious metals, and expresses the number of ounces of silver needed for purchasing one ounce of gold.

With the price of Gold currently at $1,980/oz and Silver at $24/oz, the ratio lies at 82.50 (1.980/24), which is much lower than the 91 traded in early March before the collapse of the two U.S. banks.

With the ratio being nearly 80 mark, it is clearly indicating the solid rebound of silver seen in the last two weeks of the banking crisis and its overperformance versus gold amid the combined haven and industrial demand.

Industrial demand:

Silver in comparison to gold witch it enjoys a close safe-haven correlation from ancient times, it has also a strong demand for industrial usage since silver has been a key component in the energy transition and the technology revolution.

The white metal is expected to have a growing demand from different industrial sectors – especially the photovoltaic and electric car batteries – which are expected to further boost its demand in the next few years on a global scale as part of the green transition and innovation.

Commodities investors are fleeing into silver due to its crucial role in the energy transition where its conductive qualities see it used in photovoltaics for solar energy and in the batteries of electric vehicles.

Gold-silver ratio:

Another sign of the recent strength in the price of silver is the gold-silver ratio, which is analyzing the ratio between the two precious metals, and expresses the number of ounces of silver needed for purchasing one ounce of gold.

With the price of Gold currently at $1,980/oz and Silver at $24/oz, the ratio lies at 82.50 (1.980/24), which is much lower than the 91 traded in early March before the collapse of the two U.S. banks.

With the ratio being nearly 80 mark, it is clearly indicating the solid rebound of silver seen in the last two weeks of the banking crisis and its overperformance versus gold amid the combined haven and industrial demand.

Industrial demand:

Silver in comparison to gold witch it enjoys a close safe-haven correlation from ancient times, it has also a strong demand for industrial usage since silver has been a key component in the energy transition and the technology revolution.

The white metal is expected to have a growing demand from different industrial sectors – especially the photovoltaic and electric car batteries – which are expected to further boost its demand in the next few years on a global scale as part of the green transition and innovation.

Commodities investors are fleeing into silver due to its crucial role in the energy transition where its conductive qualities see it used in photovoltaics for solar energy and in the batteries of electric vehicles.

From a technical perspective, the trend for silver remains strong to the upside. A clear surpass of the $24.50 key resistance level (January highs) could open space for a new recovery to the next resistance zones at $27 and then toward the $30 key psychological level.

Gold-silver ratio:

Another sign of the recent strength in the price of silver is the gold-silver ratio, which is analyzing the ratio between the two precious metals, and expresses the number of ounces of silver needed for purchasing one ounce of gold.

With the price of Gold currently at $1,980/oz and Silver at $24/oz, the ratio lies at 82.50 (1.980/24), which is much lower than the 91 traded in early March before the collapse of the two U.S. banks.

With the ratio being nearly 80 mark, it is clearly indicating the solid rebound of silver seen in the last two weeks of the banking crisis and its overperformance versus gold amid the combined haven and industrial demand.

Industrial demand:

Silver in comparison to gold witch it enjoys a close safe-haven correlation from ancient times, it has also a strong demand for industrial usage since silver has been a key component in the energy transition and the technology revolution.

The white metal is expected to have a growing demand from different industrial sectors – especially the photovoltaic and electric car batteries – which are expected to further boost its demand in the next few years on a global scale as part of the green transition and innovation.

Commodities investors are fleeing into silver due to its crucial role in the energy transition where its conductive qualities see it used in photovoltaics for solar energy and in the batteries of electric vehicles.

The banking turmoil, the falling dollar, and bond yields following the expectations for a less hawkish Federal Reserve have lifted safe-haven bullion, resulting in silver gaining around 20% from the March bottom in bullish momentum.

From a technical perspective, the trend for silver remains strong to the upside. A clear surpass of the $24.50 key resistance level (January highs) could open space for a new recovery to the next resistance zones at $27 and then toward the $30 key psychological level.

Gold-silver ratio:

Another sign of the recent strength in the price of silver is the gold-silver ratio, which is analyzing the ratio between the two precious metals, and expresses the number of ounces of silver needed for purchasing one ounce of gold.

With the price of Gold currently at $1,980/oz and Silver at $24/oz, the ratio lies at 82.50 (1.980/24), which is much lower than the 91 traded in early March before the collapse of the two U.S. banks.

With the ratio being nearly 80 mark, it is clearly indicating the solid rebound of silver seen in the last two weeks of the banking crisis and its overperformance versus gold amid the combined haven and industrial demand.

Industrial demand:

Silver in comparison to gold witch it enjoys a close safe-haven correlation from ancient times, it has also a strong demand for industrial usage since silver has been a key component in the energy transition and the technology revolution.

The white metal is expected to have a growing demand from different industrial sectors – especially the photovoltaic and electric car batteries – which are expected to further boost its demand in the next few years on a global scale as part of the green transition and innovation.

Commodities investors are fleeing into silver due to its crucial role in the energy transition where its conductive qualities see it used in photovoltaics for solar energy and in the batteries of electric vehicles.

Together with Gold, which climbed briefly above the $2,000 key psychological level last week, the white metal has been posting a significant upward momentum rally since early March, seeing its price bouncing from monthly lows of $19.80/oz to as high as $24/oz this morning.

The banking turmoil, the falling dollar, and bond yields following the expectations for a less hawkish Federal Reserve have lifted safe-haven bullion, resulting in silver gaining around 20% from the March bottom in bullish momentum.

From a technical perspective, the trend for silver remains strong to the upside. A clear surpass of the $24.50 key resistance level (January highs) could open space for a new recovery to the next resistance zones at $27 and then toward the $30 key psychological level.

Gold-silver ratio:

Another sign of the recent strength in the price of silver is the gold-silver ratio, which is analyzing the ratio between the two precious metals, and expresses the number of ounces of silver needed for purchasing one ounce of gold.

With the price of Gold currently at $1,980/oz and Silver at $24/oz, the ratio lies at 82.50 (1.980/24), which is much lower than the 91 traded in early March before the collapse of the two U.S. banks.

With the ratio being nearly 80 mark, it is clearly indicating the solid rebound of silver seen in the last two weeks of the banking crisis and its overperformance versus gold amid the combined haven and industrial demand.

Industrial demand:

Silver in comparison to gold witch it enjoys a close safe-haven correlation from ancient times, it has also a strong demand for industrial usage since silver has been a key component in the energy transition and the technology revolution.

The white metal is expected to have a growing demand from different industrial sectors – especially the photovoltaic and electric car batteries – which are expected to further boost its demand in the next few years on a global scale as part of the green transition and innovation.

Commodities investors are fleeing into silver due to its crucial role in the energy transition where its conductive qualities see it used in photovoltaics for solar energy and in the batteries of electric vehicles.

Silver price, Weekly chart

Together with Gold, which climbed briefly above the $2,000 key psychological level last week, the white metal has been posting a significant upward momentum rally since early March, seeing its price bouncing from monthly lows of $19.80/oz to as high as $24/oz this morning.

The banking turmoil, the falling dollar, and bond yields following the expectations for a less hawkish Federal Reserve have lifted safe-haven bullion, resulting in silver gaining around 20% from the March bottom in bullish momentum.

From a technical perspective, the trend for silver remains strong to the upside. A clear surpass of the $24.50 key resistance level (January highs) could open space for a new recovery to the next resistance zones at $27 and then toward the $30 key psychological level.

Gold-silver ratio:

Another sign of the recent strength in the price of silver is the gold-silver ratio, which is analyzing the ratio between the two precious metals, and expresses the number of ounces of silver needed for purchasing one ounce of gold.

With the price of Gold currently at $1,980/oz and Silver at $24/oz, the ratio lies at 82.50 (1.980/24), which is much lower than the 91 traded in early March before the collapse of the two U.S. banks.

With the ratio being nearly 80 mark, it is clearly indicating the solid rebound of silver seen in the last two weeks of the banking crisis and its overperformance versus gold amid the combined haven and industrial demand.

Industrial demand:

Silver in comparison to gold witch it enjoys a close safe-haven correlation from ancient times, it has also a strong demand for industrial usage since silver has been a key component in the energy transition and the technology revolution.

The white metal is expected to have a growing demand from different industrial sectors – especially the photovoltaic and electric car batteries – which are expected to further boost its demand in the next few years on a global scale as part of the green transition and innovation.

Commodities investors are fleeing into silver due to its crucial role in the energy transition where its conductive qualities see it used in photovoltaics for solar energy and in the batteries of electric vehicles.

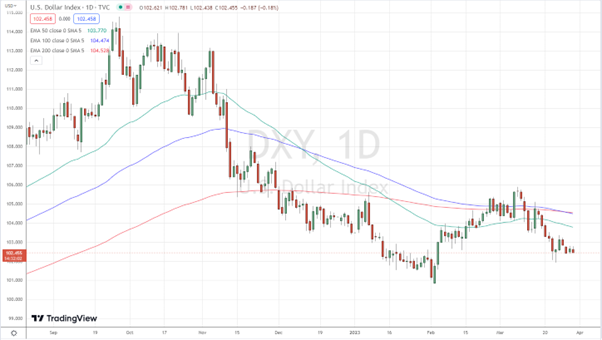
Silver extended recent gains on Thursday toward $24/oz, a level last seen at the end of January, as a softer U.S. dollar and lower bond yields drove demand for the precious metal, ahead of the U.S. inflation data due later Friday to gauge the Federal Reserve’s next policy move.

Silver price, Weekly chart

Together with Gold, which climbed briefly above the $2,000 key psychological level last week, the white metal has been posting a significant upward momentum rally since early March, seeing its price bouncing from monthly lows of $19.80/oz to as high as $24/oz this morning.

The banking turmoil, the falling dollar, and bond yields following the expectations for a less hawkish Federal Reserve have lifted safe-haven bullion, resulting in silver gaining around 20% from the March bottom in bullish momentum.

From a technical perspective, the trend for silver remains strong to the upside. A clear surpass of the $24.50 key resistance level (January highs) could open space for a new recovery to the next resistance zones at $27 and then toward the $30 key psychological level.

Gold-silver ratio:

Another sign of the recent strength in the price of silver is the gold-silver ratio, which is analyzing the ratio between the two precious metals, and expresses the number of ounces of silver needed for purchasing one ounce of gold.

With the price of Gold currently at $1,980/oz and Silver at $24/oz, the ratio lies at 82.50 (1.980/24), which is much lower than the 91 traded in early March before the collapse of the two U.S. banks.

With the ratio being nearly 80 mark, it is clearly indicating the solid rebound of silver seen in the last two weeks of the banking crisis and its overperformance versus gold amid the combined haven and industrial demand.

Industrial demand:

Silver in comparison to gold witch it enjoys a close safe-haven correlation from ancient times, it has also a strong demand for industrial usage since silver has been a key component in the energy transition and the technology revolution.

The white metal is expected to have a growing demand from different industrial sectors – especially the photovoltaic and electric car batteries – which are expected to further boost its demand in the next few years on a global scale as part of the green transition and innovation.

Commodities investors are fleeing into silver due to its crucial role in the energy transition where its conductive qualities see it used in photovoltaics for solar energy and in the batteries of electric vehicles.

U.S. dollar falls at 2-month lows ahead of key economic data

On the flip side, some investors believe that the easing fears of a banking crisis will allow Federal Reserve to keep raining interest rates until bringing inflation down to Fed’s 2% target.

On the flip side, some investors believe that the easing fears of a banking crisis will allow Federal Reserve to keep raining interest rates until bringing inflation down to Fed’s 2% target.

Market participants are now waiting for the release of the U.S. GDP and weekly jobless claims later Thursday, and Personal Consumption Expenditures data on Friday for further fresh clues on inflation, and about the state of the economy and policy plans.

On the flip side, some investors believe that the easing fears of a banking crisis will allow Federal Reserve to keep raining interest rates until bringing inflation down to Fed’s 2% target.

However, the bank crisis fears eased after the intervention by U.S. regulators that guaranteed banking deposits and liquidity in the system, while the regional U.S. lender First Citizens BancShares scooped up the assets of Silicon Valley Bank last Monday.

Market participants are now waiting for the release of the U.S. GDP and weekly jobless claims later Thursday, and Personal Consumption Expenditures data on Friday for further fresh clues on inflation, and about the state of the economy and policy plans.

On the flip side, some investors believe that the easing fears of a banking crisis will allow Federal Reserve to keep raining interest rates until bringing inflation down to Fed’s 2% target.

The dollar weakness came despite a rise in 2-y and 10-year U.S. Treasury yields back above 4% and 3.50%, respectively, which is also the result of falling demand for those safety assets vs bullion such as gold and silver.

However, the bank crisis fears eased after the intervention by U.S. regulators that guaranteed banking deposits and liquidity in the system, while the regional U.S. lender First Citizens BancShares scooped up the assets of Silicon Valley Bank last Monday.

Market participants are now waiting for the release of the U.S. GDP and weekly jobless claims later Thursday, and Personal Consumption Expenditures data on Friday for further fresh clues on inflation, and about the state of the economy and policy plans.

On the flip side, some investors believe that the easing fears of a banking crisis will allow Federal Reserve to keep raining interest rates until bringing inflation down to Fed’s 2% target.

Weakness in the dollar has benefited major peers and commodities, with Euro jumping to a two-month high of $1.0860, the Pound Sterling rising above the $1.23 level, Aussie breaking above the $0.67 key resistance level, Bitcoin rebounded to nearly $29,000, while the dollar-denominated gold and silver climbed to yearly highs of $2,000/oz and $23.50/oz respectively, and Brent crude oil to $78/b.

The dollar weakness came despite a rise in 2-y and 10-year U.S. Treasury yields back above 4% and 3.50%, respectively, which is also the result of falling demand for those safety assets vs bullion such as gold and silver.

However, the bank crisis fears eased after the intervention by U.S. regulators that guaranteed banking deposits and liquidity in the system, while the regional U.S. lender First Citizens BancShares scooped up the assets of Silicon Valley Bank last Monday.

Market participants are now waiting for the release of the U.S. GDP and weekly jobless claims later Thursday, and Personal Consumption Expenditures data on Friday for further fresh clues on inflation, and about the state of the economy and policy plans.

On the flip side, some investors believe that the easing fears of a banking crisis will allow Federal Reserve to keep raining interest rates until bringing inflation down to Fed’s 2% target.

The dollar will remain very sensitive and vulnerable to signs of any further cracks in the U.S. banking system, and local economy.

Weakness in the dollar has benefited major peers and commodities, with Euro jumping to a two-month high of $1.0860, the Pound Sterling rising above the $1.23 level, Aussie breaking above the $0.67 key resistance level, Bitcoin rebounded to nearly $29,000, while the dollar-denominated gold and silver climbed to yearly highs of $2,000/oz and $23.50/oz respectively, and Brent crude oil to $78/b.

The dollar weakness came despite a rise in 2-y and 10-year U.S. Treasury yields back above 4% and 3.50%, respectively, which is also the result of falling demand for those safety assets vs bullion such as gold and silver.

However, the bank crisis fears eased after the intervention by U.S. regulators that guaranteed banking deposits and liquidity in the system, while the regional U.S. lender First Citizens BancShares scooped up the assets of Silicon Valley Bank last Monday.

Market participants are now waiting for the release of the U.S. GDP and weekly jobless claims later Thursday, and Personal Consumption Expenditures data on Friday for further fresh clues on inflation, and about the state of the economy and policy plans.

On the flip side, some investors believe that the easing fears of a banking crisis will allow Federal Reserve to keep raining interest rates until bringing inflation down to Fed’s 2% target.

The banking failure caused a selloff across the board in Wall Street amid risk aversion sentiment, and fuelled jitters about the strength of the U.S. economy, which put in question the dollar outlook.

The dollar will remain very sensitive and vulnerable to signs of any further cracks in the U.S. banking system, and local economy.

Weakness in the dollar has benefited major peers and commodities, with Euro jumping to a two-month high of $1.0860, the Pound Sterling rising above the $1.23 level, Aussie breaking above the $0.67 key resistance level, Bitcoin rebounded to nearly $29,000, while the dollar-denominated gold and silver climbed to yearly highs of $2,000/oz and $23.50/oz respectively, and Brent crude oil to $78/b.

The dollar weakness came despite a rise in 2-y and 10-year U.S. Treasury yields back above 4% and 3.50%, respectively, which is also the result of falling demand for those safety assets vs bullion such as gold and silver.

However, the bank crisis fears eased after the intervention by U.S. regulators that guaranteed banking deposits and liquidity in the system, while the regional U.S. lender First Citizens BancShares scooped up the assets of Silicon Valley Bank last Monday.

Market participants are now waiting for the release of the U.S. GDP and weekly jobless claims later Thursday, and Personal Consumption Expenditures data on Friday for further fresh clues on inflation, and about the state of the economy and policy plans.

On the flip side, some investors believe that the easing fears of a banking crisis will allow Federal Reserve to keep raining interest rates until bringing inflation down to Fed’s 2% target.

The dollar index, which tracks the greenback against six major peers has been remaining on the back foot since the start of the banking turmoil in early March with the collapse of Silicon Valley Bank and Signature Bank.

The banking failure caused a selloff across the board in Wall Street amid risk aversion sentiment, and fuelled jitters about the strength of the U.S. economy, which put in question the dollar outlook.

The dollar will remain very sensitive and vulnerable to signs of any further cracks in the U.S. banking system, and local economy.

Weakness in the dollar has benefited major peers and commodities, with Euro jumping to a two-month high of $1.0860, the Pound Sterling rising above the $1.23 level, Aussie breaking above the $0.67 key resistance level, Bitcoin rebounded to nearly $29,000, while the dollar-denominated gold and silver climbed to yearly highs of $2,000/oz and $23.50/oz respectively, and Brent crude oil to $78/b.

The dollar weakness came despite a rise in 2-y and 10-year U.S. Treasury yields back above 4% and 3.50%, respectively, which is also the result of falling demand for those safety assets vs bullion such as gold and silver.

However, the bank crisis fears eased after the intervention by U.S. regulators that guaranteed banking deposits and liquidity in the system, while the regional U.S. lender First Citizens BancShares scooped up the assets of Silicon Valley Bank last Monday.

Market participants are now waiting for the release of the U.S. GDP and weekly jobless claims later Thursday, and Personal Consumption Expenditures data on Friday for further fresh clues on inflation, and about the state of the economy and policy plans.

On the flip side, some investors believe that the easing fears of a banking crisis will allow Federal Reserve to keep raining interest rates until bringing inflation down to Fed’s 2% target.

DXY-U.S. dollar index, Daily chart

The dollar index, which tracks the greenback against six major peers has been remaining on the back foot since the start of the banking turmoil in early March with the collapse of Silicon Valley Bank and Signature Bank.

The banking failure caused a selloff across the board in Wall Street amid risk aversion sentiment, and fuelled jitters about the strength of the U.S. economy, which put in question the dollar outlook.

The dollar will remain very sensitive and vulnerable to signs of any further cracks in the U.S. banking system, and local economy.

Weakness in the dollar has benefited major peers and commodities, with Euro jumping to a two-month high of $1.0860, the Pound Sterling rising above the $1.23 level, Aussie breaking above the $0.67 key resistance level, Bitcoin rebounded to nearly $29,000, while the dollar-denominated gold and silver climbed to yearly highs of $2,000/oz and $23.50/oz respectively, and Brent crude oil to $78/b.

The dollar weakness came despite a rise in 2-y and 10-year U.S. Treasury yields back above 4% and 3.50%, respectively, which is also the result of falling demand for those safety assets vs bullion such as gold and silver.

However, the bank crisis fears eased after the intervention by U.S. regulators that guaranteed banking deposits and liquidity in the system, while the regional U.S. lender First Citizens BancShares scooped up the assets of Silicon Valley Bank last Monday.

Market participants are now waiting for the release of the U.S. GDP and weekly jobless claims later Thursday, and Personal Consumption Expenditures data on Friday for further fresh clues on inflation, and about the state of the economy and policy plans.

On the flip side, some investors believe that the easing fears of a banking crisis will allow Federal Reserve to keep raining interest rates until bringing inflation down to Fed’s 2% target.

DXY-U.S. dollar index traded to a nearly two-month low of 102.50 on Thursday morning following two weeks of steep losses on the back of the recent collapse of several U.S. banks and the prospect of any pauses in the Fed’s rate hikes.

DXY-U.S. dollar index, Daily chart

The dollar index, which tracks the greenback against six major peers has been remaining on the back foot since the start of the banking turmoil in early March with the collapse of Silicon Valley Bank and Signature Bank.

The banking failure caused a selloff across the board in Wall Street amid risk aversion sentiment, and fuelled jitters about the strength of the U.S. economy, which put in question the dollar outlook.

The dollar will remain very sensitive and vulnerable to signs of any further cracks in the U.S. banking system, and local economy.

Weakness in the dollar has benefited major peers and commodities, with Euro jumping to a two-month high of $1.0860, the Pound Sterling rising above the $1.23 level, Aussie breaking above the $0.67 key resistance level, Bitcoin rebounded to nearly $29,000, while the dollar-denominated gold and silver climbed to yearly highs of $2,000/oz and $23.50/oz respectively, and Brent crude oil to $78/b.

The dollar weakness came despite a rise in 2-y and 10-year U.S. Treasury yields back above 4% and 3.50%, respectively, which is also the result of falling demand for those safety assets vs bullion such as gold and silver.

However, the bank crisis fears eased after the intervention by U.S. regulators that guaranteed banking deposits and liquidity in the system, while the regional U.S. lender First Citizens BancShares scooped up the assets of Silicon Valley Bank last Monday.

Market participants are now waiting for the release of the U.S. GDP and weekly jobless claims later Thursday, and Personal Consumption Expenditures data on Friday for further fresh clues on inflation, and about the state of the economy and policy plans.

On the flip side, some investors believe that the easing fears of a banking crisis will allow Federal Reserve to keep raining interest rates until bringing inflation down to Fed’s 2% target.

Brent jumps 5% on supply disruption from Kurdistan region in Iraq

As a result, Iraq’s output has stalled at around 4.5 million barrels per day (bpd) since 2016, delaying the country’s 2027-2028 target to reach 7-8 million bpd output capacity in the absence of local and foreign investments amid chronic military and civil wars, political infighting, and the threat of ISIS terrorism.

As a result, Iraq’s output has stalled at around 4.5 million barrels per day (bpd) since 2016, delaying the country’s 2027-2028 target to reach 7-8 million bpd output capacity in the absence of local and foreign investments amid chronic military and civil wars, political infighting, and the threat of ISIS terrorism.

Under a recent OPEC+ supply policy agreement, Iraq’s crude oil production target is 4.43 million bpd until December 2023, with the country struggling to add extra barrels of supply and exploit its huge oil reserves in the ground amid the lack of investments in energy infrastructures.

As a result, Iraq’s output has stalled at around 4.5 million barrels per day (bpd) since 2016, delaying the country’s 2027-2028 target to reach 7-8 million bpd output capacity in the absence of local and foreign investments amid chronic military and civil wars, political infighting, and the threat of ISIS terrorism.

Iraq’s oil output:

Under a recent OPEC+ supply policy agreement, Iraq’s crude oil production target is 4.43 million bpd until December 2023, with the country struggling to add extra barrels of supply and exploit its huge oil reserves in the ground amid the lack of investments in energy infrastructures.

As a result, Iraq’s output has stalled at around 4.5 million barrels per day (bpd) since 2016, delaying the country’s 2027-2028 target to reach 7-8 million bpd output capacity in the absence of local and foreign investments amid chronic military and civil wars, political infighting, and the threat of ISIS terrorism.

Authorities in Ankara, Baghdad, and Erbil are still in discussion to reach agreements that will allow oil exports to resume through the pipeline to the port of Ceyhan on the Mediterranean.

Iraq’s oil output:

Under a recent OPEC+ supply policy agreement, Iraq’s crude oil production target is 4.43 million bpd until December 2023, with the country struggling to add extra barrels of supply and exploit its huge oil reserves in the ground amid the lack of investments in energy infrastructures.

As a result, Iraq’s output has stalled at around 4.5 million barrels per day (bpd) since 2016, delaying the country’s 2027-2028 target to reach 7-8 million bpd output capacity in the absence of local and foreign investments amid chronic military and civil wars, political infighting, and the threat of ISIS terrorism.

Following the decision by the International Chamber of Commerce, Turkey told Iraq it would respect the ruling, while Baghdad halted the exports from Kurdistan.

Authorities in Ankara, Baghdad, and Erbil are still in discussion to reach agreements that will allow oil exports to resume through the pipeline to the port of Ceyhan on the Mediterranean.

Iraq’s oil output:

Under a recent OPEC+ supply policy agreement, Iraq’s crude oil production target is 4.43 million bpd until December 2023, with the country struggling to add extra barrels of supply and exploit its huge oil reserves in the ground amid the lack of investments in energy infrastructures.

As a result, Iraq’s output has stalled at around 4.5 million barrels per day (bpd) since 2016, delaying the country’s 2027-2028 target to reach 7-8 million bpd output capacity in the absence of local and foreign investments amid chronic military and civil wars, political infighting, and the threat of ISIS terrorism.

Last Thursday, the International Chamber of Commerce ruled in favor of Iraq against Turkey in a dispute over crude flows from Kurdistan. Iraq had argued that Turkey shouldn’t allow Kurdish oil exports via the Iraq-Turkey pipeline and the Turkish port of Ceyhan without approval from the federal government of Iraq.

Following the decision by the International Chamber of Commerce, Turkey told Iraq it would respect the ruling, while Baghdad halted the exports from Kurdistan.

Authorities in Ankara, Baghdad, and Erbil are still in discussion to reach agreements that will allow oil exports to resume through the pipeline to the port of Ceyhan on the Mediterranean.

Iraq’s oil output:

Under a recent OPEC+ supply policy agreement, Iraq’s crude oil production target is 4.43 million bpd until December 2023, with the country struggling to add extra barrels of supply and exploit its huge oil reserves in the ground amid the lack of investments in energy infrastructures.

As a result, Iraq’s output has stalled at around 4.5 million barrels per day (bpd) since 2016, delaying the country’s 2027-2028 target to reach 7-8 million bpd output capacity in the absence of local and foreign investments amid chronic military and civil wars, political infighting, and the threat of ISIS terrorism.

Officials from the federal Iraqi government and the Kurdistan Regional Government met on Sunday in Baghdad, failing to reach an agreement on the resumption of crude flows, disrupting 470k bpd from the already tight global supply market.

Last Thursday, the International Chamber of Commerce ruled in favor of Iraq against Turkey in a dispute over crude flows from Kurdistan. Iraq had argued that Turkey shouldn’t allow Kurdish oil exports via the Iraq-Turkey pipeline and the Turkish port of Ceyhan without approval from the federal government of Iraq.

Following the decision by the International Chamber of Commerce, Turkey told Iraq it would respect the ruling, while Baghdad halted the exports from Kurdistan.

Authorities in Ankara, Baghdad, and Erbil are still in discussion to reach agreements that will allow oil exports to resume through the pipeline to the port of Ceyhan on the Mediterranean.

Iraq’s oil output:

Under a recent OPEC+ supply policy agreement, Iraq’s crude oil production target is 4.43 million bpd until December 2023, with the country struggling to add extra barrels of supply and exploit its huge oil reserves in the ground amid the lack of investments in energy infrastructures.

As a result, Iraq’s output has stalled at around 4.5 million barrels per day (bpd) since 2016, delaying the country’s 2027-2028 target to reach 7-8 million bpd output capacity in the absence of local and foreign investments amid chronic military and civil wars, political infighting, and the threat of ISIS terrorism.

Brent crude, 2-hour chart

Officials from the federal Iraqi government and the Kurdistan Regional Government met on Sunday in Baghdad, failing to reach an agreement on the resumption of crude flows, disrupting 470k bpd from the already tight global supply market.

Last Thursday, the International Chamber of Commerce ruled in favor of Iraq against Turkey in a dispute over crude flows from Kurdistan. Iraq had argued that Turkey shouldn’t allow Kurdish oil exports via the Iraq-Turkey pipeline and the Turkish port of Ceyhan without approval from the federal government of Iraq.

Following the decision by the International Chamber of Commerce, Turkey told Iraq it would respect the ruling, while Baghdad halted the exports from Kurdistan.

Authorities in Ankara, Baghdad, and Erbil are still in discussion to reach agreements that will allow oil exports to resume through the pipeline to the port of Ceyhan on the Mediterranean.

Iraq’s oil output:

Under a recent OPEC+ supply policy agreement, Iraq’s crude oil production target is 4.43 million bpd until December 2023, with the country struggling to add extra barrels of supply and exploit its huge oil reserves in the ground amid the lack of investments in energy infrastructures.

As a result, Iraq’s output has stalled at around 4.5 million barrels per day (bpd) since 2016, delaying the country’s 2027-2028 target to reach 7-8 million bpd output capacity in the absence of local and foreign investments amid chronic military and civil wars, political infighting, and the threat of ISIS terrorism.

Prior to the shutdown, the 1000 km long Kirkuk-Ceyhan oil pipeline – Iraq’s largest crude oil export line- carried some 400,000 barrels a day of Kurdish oil and another 70,000 barrels a day of Iraqi oil to global markets via the Mediterranean Sea.

Brent crude, 2-hour chart

Officials from the federal Iraqi government and the Kurdistan Regional Government met on Sunday in Baghdad, failing to reach an agreement on the resumption of crude flows, disrupting 470k bpd from the already tight global supply market.

Last Thursday, the International Chamber of Commerce ruled in favor of Iraq against Turkey in a dispute over crude flows from Kurdistan. Iraq had argued that Turkey shouldn’t allow Kurdish oil exports via the Iraq-Turkey pipeline and the Turkish port of Ceyhan without approval from the federal government of Iraq.

Following the decision by the International Chamber of Commerce, Turkey told Iraq it would respect the ruling, while Baghdad halted the exports from Kurdistan.

Authorities in Ankara, Baghdad, and Erbil are still in discussion to reach agreements that will allow oil exports to resume through the pipeline to the port of Ceyhan on the Mediterranean.

Iraq’s oil output:

Under a recent OPEC+ supply policy agreement, Iraq’s crude oil production target is 4.43 million bpd until December 2023, with the country struggling to add extra barrels of supply and exploit its huge oil reserves in the ground amid the lack of investments in energy infrastructures.

As a result, Iraq’s output has stalled at around 4.5 million barrels per day (bpd) since 2016, delaying the country’s 2027-2028 target to reach 7-8 million bpd output capacity in the absence of local and foreign investments amid chronic military and civil wars, political infighting, and the threat of ISIS terrorism.

According to Reuters, about 0.5% of the global oil supply, or 470,000 barrels per day (bpd), of crude exports from the northern Kirkuk fields in the Kurdistan region stopped on Saturday after a decision in an arbitration case confirmed Iraq’s consent was needed to ship the oil from Turkey, indicating that this could also force cuts to oil output in the Kurdistan region.

Prior to the shutdown, the 1000 km long Kirkuk-Ceyhan oil pipeline – Iraq’s largest crude oil export line- carried some 400,000 barrels a day of Kurdish oil and another 70,000 barrels a day of Iraqi oil to global markets via the Mediterranean Sea.

Brent crude, 2-hour chart

Officials from the federal Iraqi government and the Kurdistan Regional Government met on Sunday in Baghdad, failing to reach an agreement on the resumption of crude flows, disrupting 470k bpd from the already tight global supply market.

Last Thursday, the International Chamber of Commerce ruled in favor of Iraq against Turkey in a dispute over crude flows from Kurdistan. Iraq had argued that Turkey shouldn’t allow Kurdish oil exports via the Iraq-Turkey pipeline and the Turkish port of Ceyhan without approval from the federal government of Iraq.

Following the decision by the International Chamber of Commerce, Turkey told Iraq it would respect the ruling, while Baghdad halted the exports from Kurdistan.

Authorities in Ankara, Baghdad, and Erbil are still in discussion to reach agreements that will allow oil exports to resume through the pipeline to the port of Ceyhan on the Mediterranean.

Iraq’s oil output:

Under a recent OPEC+ supply policy agreement, Iraq’s crude oil production target is 4.43 million bpd until December 2023, with the country struggling to add extra barrels of supply and exploit its huge oil reserves in the ground amid the lack of investments in energy infrastructures.

As a result, Iraq’s output has stalled at around 4.5 million barrels per day (bpd) since 2016, delaying the country’s 2027-2028 target to reach 7-8 million bpd output capacity in the absence of local and foreign investments amid chronic military and civil wars, political infighting, and the threat of ISIS terrorism.

Crude oil prices managed to bounce significantly from their 15-month lows on the back of the news that Kurdistan’s crude oil exports from the Ceyhan port continue to be shut in for a fourth day.

According to Reuters, about 0.5% of the global oil supply, or 470,000 barrels per day (bpd), of crude exports from the northern Kirkuk fields in the Kurdistan region stopped on Saturday after a decision in an arbitration case confirmed Iraq’s consent was needed to ship the oil from Turkey, indicating that this could also force cuts to oil output in the Kurdistan region.

Prior to the shutdown, the 1000 km long Kirkuk-Ceyhan oil pipeline – Iraq’s largest crude oil export line- carried some 400,000 barrels a day of Kurdish oil and another 70,000 barrels a day of Iraqi oil to global markets via the Mediterranean Sea.

Brent crude, 2-hour chart

Officials from the federal Iraqi government and the Kurdistan Regional Government met on Sunday in Baghdad, failing to reach an agreement on the resumption of crude flows, disrupting 470k bpd from the already tight global supply market.

Last Thursday, the International Chamber of Commerce ruled in favor of Iraq against Turkey in a dispute over crude flows from Kurdistan. Iraq had argued that Turkey shouldn’t allow Kurdish oil exports via the Iraq-Turkey pipeline and the Turkish port of Ceyhan without approval from the federal government of Iraq.

Following the decision by the International Chamber of Commerce, Turkey told Iraq it would respect the ruling, while Baghdad halted the exports from Kurdistan.

Authorities in Ankara, Baghdad, and Erbil are still in discussion to reach agreements that will allow oil exports to resume through the pipeline to the port of Ceyhan on the Mediterranean.

Iraq’s oil output:

Under a recent OPEC+ supply policy agreement, Iraq’s crude oil production target is 4.43 million bpd until December 2023, with the country struggling to add extra barrels of supply and exploit its huge oil reserves in the ground amid the lack of investments in energy infrastructures.

As a result, Iraq’s output has stalled at around 4.5 million barrels per day (bpd) since 2016, delaying the country’s 2027-2028 target to reach 7-8 million bpd output capacity in the absence of local and foreign investments amid chronic military and civil wars, political infighting, and the threat of ISIS terrorism.

Market reaction:

Crude oil prices managed to bounce significantly from their 15-month lows on the back of the news that Kurdistan’s crude oil exports from the Ceyhan port continue to be shut in for a fourth day.

According to Reuters, about 0.5% of the global oil supply, or 470,000 barrels per day (bpd), of crude exports from the northern Kirkuk fields in the Kurdistan region stopped on Saturday after a decision in an arbitration case confirmed Iraq’s consent was needed to ship the oil from Turkey, indicating that this could also force cuts to oil output in the Kurdistan region.

Prior to the shutdown, the 1000 km long Kirkuk-Ceyhan oil pipeline – Iraq’s largest crude oil export line- carried some 400,000 barrels a day of Kurdish oil and another 70,000 barrels a day of Iraqi oil to global markets via the Mediterranean Sea.

Brent crude, 2-hour chart

Officials from the federal Iraqi government and the Kurdistan Regional Government met on Sunday in Baghdad, failing to reach an agreement on the resumption of crude flows, disrupting 470k bpd from the already tight global supply market.

Last Thursday, the International Chamber of Commerce ruled in favor of Iraq against Turkey in a dispute over crude flows from Kurdistan. Iraq had argued that Turkey shouldn’t allow Kurdish oil exports via the Iraq-Turkey pipeline and the Turkish port of Ceyhan without approval from the federal government of Iraq.

Following the decision by the International Chamber of Commerce, Turkey told Iraq it would respect the ruling, while Baghdad halted the exports from Kurdistan.

Authorities in Ankara, Baghdad, and Erbil are still in discussion to reach agreements that will allow oil exports to resume through the pipeline to the port of Ceyhan on the Mediterranean.

Iraq’s oil output:

Under a recent OPEC+ supply policy agreement, Iraq’s crude oil production target is 4.43 million bpd until December 2023, with the country struggling to add extra barrels of supply and exploit its huge oil reserves in the ground amid the lack of investments in energy infrastructures.

As a result, Iraq’s output has stalled at around 4.5 million barrels per day (bpd) since 2016, delaying the country’s 2027-2028 target to reach 7-8 million bpd output capacity in the absence of local and foreign investments amid chronic military and civil wars, political infighting, and the threat of ISIS terrorism.

This is a chronic problem in modern Iraq based on the dispute between the KRG- Kurdistan Regional Government (an oil-rich semi-autonomous region in northern Iraq) and the federal government of Iraq over who has the right to control the oil resources and revenues in the Kurdistan region.

Market reaction:

Crude oil prices managed to bounce significantly from their 15-month lows on the back of the news that Kurdistan’s crude oil exports from the Ceyhan port continue to be shut in for a fourth day.

According to Reuters, about 0.5% of the global oil supply, or 470,000 barrels per day (bpd), of crude exports from the northern Kirkuk fields in the Kurdistan region stopped on Saturday after a decision in an arbitration case confirmed Iraq’s consent was needed to ship the oil from Turkey, indicating that this could also force cuts to oil output in the Kurdistan region.

Prior to the shutdown, the 1000 km long Kirkuk-Ceyhan oil pipeline – Iraq’s largest crude oil export line- carried some 400,000 barrels a day of Kurdish oil and another 70,000 barrels a day of Iraqi oil to global markets via the Mediterranean Sea.

Brent crude, 2-hour chart

Officials from the federal Iraqi government and the Kurdistan Regional Government met on Sunday in Baghdad, failing to reach an agreement on the resumption of crude flows, disrupting 470k bpd from the already tight global supply market.

Last Thursday, the International Chamber of Commerce ruled in favor of Iraq against Turkey in a dispute over crude flows from Kurdistan. Iraq had argued that Turkey shouldn’t allow Kurdish oil exports via the Iraq-Turkey pipeline and the Turkish port of Ceyhan without approval from the federal government of Iraq.

Following the decision by the International Chamber of Commerce, Turkey told Iraq it would respect the ruling, while Baghdad halted the exports from Kurdistan.

Authorities in Ankara, Baghdad, and Erbil are still in discussion to reach agreements that will allow oil exports to resume through the pipeline to the port of Ceyhan on the Mediterranean.

Iraq’s oil output:

Under a recent OPEC+ supply policy agreement, Iraq’s crude oil production target is 4.43 million bpd until December 2023, with the country struggling to add extra barrels of supply and exploit its huge oil reserves in the ground amid the lack of investments in energy infrastructures.

As a result, Iraq’s output has stalled at around 4.5 million barrels per day (bpd) since 2016, delaying the country’s 2027-2028 target to reach 7-8 million bpd output capacity in the absence of local and foreign investments amid chronic military and civil wars, political infighting, and the threat of ISIS terrorism.

Both Brent and WTI crude jumped over 5% to $78/b and $73/b respectively on Monday; this on the heel of news that the Turkish port of Ceyhan stopped pumping crude from a Kurdistan pipeline. The latter follows an arbitration ruling in favor of Iraq against Turkey for transporting Kurdish oil without prior approval from Baghdad.

This is a chronic problem in modern Iraq based on the dispute between the KRG- Kurdistan Regional Government (an oil-rich semi-autonomous region in northern Iraq) and the federal government of Iraq over who has the right to control the oil resources and revenues in the Kurdistan region.

Market reaction:

Crude oil prices managed to bounce significantly from their 15-month lows on the back of the news that Kurdistan’s crude oil exports from the Ceyhan port continue to be shut in for a fourth day.

According to Reuters, about 0.5% of the global oil supply, or 470,000 barrels per day (bpd), of crude exports from the northern Kirkuk fields in the Kurdistan region stopped on Saturday after a decision in an arbitration case confirmed Iraq’s consent was needed to ship the oil from Turkey, indicating that this could also force cuts to oil output in the Kurdistan region.

Prior to the shutdown, the 1000 km long Kirkuk-Ceyhan oil pipeline – Iraq’s largest crude oil export line- carried some 400,000 barrels a day of Kurdish oil and another 70,000 barrels a day of Iraqi oil to global markets via the Mediterranean Sea.

Brent crude, 2-hour chart

Officials from the federal Iraqi government and the Kurdistan Regional Government met on Sunday in Baghdad, failing to reach an agreement on the resumption of crude flows, disrupting 470k bpd from the already tight global supply market.

Last Thursday, the International Chamber of Commerce ruled in favor of Iraq against Turkey in a dispute over crude flows from Kurdistan. Iraq had argued that Turkey shouldn’t allow Kurdish oil exports via the Iraq-Turkey pipeline and the Turkish port of Ceyhan without approval from the federal government of Iraq.

Following the decision by the International Chamber of Commerce, Turkey told Iraq it would respect the ruling, while Baghdad halted the exports from Kurdistan.

Authorities in Ankara, Baghdad, and Erbil are still in discussion to reach agreements that will allow oil exports to resume through the pipeline to the port of Ceyhan on the Mediterranean.

Iraq’s oil output:

Under a recent OPEC+ supply policy agreement, Iraq’s crude oil production target is 4.43 million bpd until December 2023, with the country struggling to add extra barrels of supply and exploit its huge oil reserves in the ground amid the lack of investments in energy infrastructures.

As a result, Iraq’s output has stalled at around 4.5 million barrels per day (bpd) since 2016, delaying the country’s 2027-2028 target to reach 7-8 million bpd output capacity in the absence of local and foreign investments amid chronic military and civil wars, political infighting, and the threat of ISIS terrorism.

Crude oil trades to near a 15-month low as bank fears persist


Energy investors have also been closely monitoring the recent escalation in Eastern Europe after Russian President Vladimir Putin’s statement that he would station tactical nuclear weapons in Belarus.


Energy investors have also been closely monitoring the recent escalation in Eastern Europe after Russian President Vladimir Putin’s statement that he would station tactical nuclear weapons in Belarus.


Banking stocks have been battered in March following the sudden failures of two regional U.S. lenders, the Silicon Valley Bank, and the Signature Bank, and the emergency sale of embattled Swiss bank Credit Suisse to rival UBS.

Energy investors have also been closely monitoring the recent escalation in Eastern Europe after Russian President Vladimir Putin’s statement that he would station tactical nuclear weapons in Belarus.


Appetite for risk and growth-led assets turned lower last week following the selloff in the global banking sector driven by the worries over the heavyweights Deutsche Bank and UBS Group, Germany’s, and Switzerland’s largest lenders, with investors moving to the safety of the gold, silver, Japanese yen, and greenback.

Banking stocks have been battered in March following the sudden failures of two regional U.S. lenders, the Silicon Valley Bank, and the Signature Bank, and the emergency sale of embattled Swiss bank Credit Suisse to rival UBS.

Energy investors have also been closely monitoring the recent escalation in Eastern Europe after Russian President Vladimir Putin’s statement that he would station tactical nuclear weapons in Belarus.


Brent crude, Daily chart

Appetite for risk and growth-led assets turned lower last week following the selloff in the global banking sector driven by the worries over the heavyweights Deutsche Bank and UBS Group, Germany’s, and Switzerland’s largest lenders, with investors moving to the safety of the gold, silver, Japanese yen, and greenback.

Banking stocks have been battered in March following the sudden failures of two regional U.S. lenders, the Silicon Valley Bank, and the Signature Bank, and the emergency sale of embattled Swiss bank Credit Suisse to rival UBS.

Energy investors have also been closely monitoring the recent escalation in Eastern Europe after Russian President Vladimir Putin’s statement that he would station tactical nuclear weapons in Belarus.


Both Brent and WTI crude oil prices have lost more than 12% since early March on the back of the banking crisis, given the interconnectedness of the financial sector with commodities, especially the energy sector.

Brent crude, Daily chart

Appetite for risk and growth-led assets turned lower last week following the selloff in the global banking sector driven by the worries over the heavyweights Deutsche Bank and UBS Group, Germany’s, and Switzerland’s largest lenders, with investors moving to the safety of the gold, silver, Japanese yen, and greenback.

Banking stocks have been battered in March following the sudden failures of two regional U.S. lenders, the Silicon Valley Bank, and the Signature Bank, and the emergency sale of embattled Swiss bank Credit Suisse to rival UBS.

Energy investors have also been closely monitoring the recent escalation in Eastern Europe after Russian President Vladimir Putin’s statement that he would station tactical nuclear weapons in Belarus.


Risk aversion sent Brent and WTI crude oil prices as low as $70/b and $64,50/b respectively on March 20, for the first time since the end of December 2021, before rebounding to the current levels of $75/b and $70/b as U.S. and European regulators rolled out a slew of measures to calm financial markets.

Both Brent and WTI crude oil prices have lost more than 12% since early March on the back of the banking crisis, given the interconnectedness of the financial sector with commodities, especially the energy sector.

Brent crude, Daily chart

Appetite for risk and growth-led assets turned lower last week following the selloff in the global banking sector driven by the worries over the heavyweights Deutsche Bank and UBS Group, Germany’s, and Switzerland’s largest lenders, with investors moving to the safety of the gold, silver, Japanese yen, and greenback.

Banking stocks have been battered in March following the sudden failures of two regional U.S. lenders, the Silicon Valley Bank, and the Signature Bank, and the emergency sale of embattled Swiss bank Credit Suisse to rival UBS.

Energy investors have also been closely monitoring the recent escalation in Eastern Europe after Russian President Vladimir Putin’s statement that he would station tactical nuclear weapons in Belarus.


Despite the increasing geopolitical tensions in Eastern Europe, energy investors are also weighing the risk of recession and the impact of interest rates on the global economic and industrial activity that will potentially hit the petroleum demand outlook.

Risk aversion sent Brent and WTI crude oil prices as low as $70/b and $64,50/b respectively on March 20, for the first time since the end of December 2021, before rebounding to the current levels of $75/b and $70/b as U.S. and European regulators rolled out a slew of measures to calm financial markets.

Both Brent and WTI crude oil prices have lost more than 12% since early March on the back of the banking crisis, given the interconnectedness of the financial sector with commodities, especially the energy sector.

Brent crude, Daily chart

Appetite for risk and growth-led assets turned lower last week following the selloff in the global banking sector driven by the worries over the heavyweights Deutsche Bank and UBS Group, Germany’s, and Switzerland’s largest lenders, with investors moving to the safety of the gold, silver, Japanese yen, and greenback.

Banking stocks have been battered in March following the sudden failures of two regional U.S. lenders, the Silicon Valley Bank, and the Signature Bank, and the emergency sale of embattled Swiss bank Credit Suisse to rival UBS.

Energy investors have also been closely monitoring the recent escalation in Eastern Europe after Russian President Vladimir Putin’s statement that he would station tactical nuclear weapons in Belarus.


Crude oil prices traded just above a 15-month low on Monday morning as market participants concern over more banking defaults around the world, following the worst banking crisis since the 2008 financial crisis.

Despite the increasing geopolitical tensions in Eastern Europe, energy investors are also weighing the risk of recession and the impact of interest rates on the global economic and industrial activity that will potentially hit the petroleum demand outlook.

Risk aversion sent Brent and WTI crude oil prices as low as $70/b and $64,50/b respectively on March 20, for the first time since the end of December 2021, before rebounding to the current levels of $75/b and $70/b as U.S. and European regulators rolled out a slew of measures to calm financial markets.

Both Brent and WTI crude oil prices have lost more than 12% since early March on the back of the banking crisis, given the interconnectedness of the financial sector with commodities, especially the energy sector.

Brent crude, Daily chart

Appetite for risk and growth-led assets turned lower last week following the selloff in the global banking sector driven by the worries over the heavyweights Deutsche Bank and UBS Group, Germany’s, and Switzerland’s largest lenders, with investors moving to the safety of the gold, silver, Japanese yen, and greenback.

Banking stocks have been battered in March following the sudden failures of two regional U.S. lenders, the Silicon Valley Bank, and the Signature Bank, and the emergency sale of embattled Swiss bank Credit Suisse to rival UBS.

Energy investors have also been closely monitoring the recent escalation in Eastern Europe after Russian President Vladimir Putin’s statement that he would station tactical nuclear weapons in Belarus.


U.S. dollar retreats lower ahead of Fed rate hike decision


A similar story is shown on the antipodean currencies Australian and New Zealand dollars, with the AUD/USD pair recovering toward $0.68 while the NZD/USD pair is surging above $0.6250.


A similar story is shown on the antipodean currencies Australian and New Zealand dollars, with the AUD/USD pair recovering toward $0.68 while the NZD/USD pair is surging above $0.6250.


Japanese Yen has added on last week’s gains, with the USD/JPY pair falling to nearly ¥131 level, its lowest since mid-February.

A similar story is shown on the antipodean currencies Australian and New Zealand dollars, with the AUD/USD pair recovering toward $0.68 while the NZD/USD pair is surging above $0.6250.


The softening dollar has boosted other major peers, with EUR/USD pair posting higher highs above $1.07 and rolling toward the 1.08 psychological level.

Japanese Yen has added on last week’s gains, with the USD/JPY pair falling to nearly ¥131 level, its lowest since mid-February.

A similar story is shown on the antipodean currencies Australian and New Zealand dollars, with the AUD/USD pair recovering toward $0.68 while the NZD/USD pair is surging above $0.6250.


EUR/USD pair, Daily chart

The softening dollar has boosted other major peers, with EUR/USD pair posting higher highs above $1.07 and rolling toward the 1.08 psychological level.

Japanese Yen has added on last week’s gains, with the USD/JPY pair falling to nearly ¥131 level, its lowest since mid-February.

A similar story is shown on the antipodean currencies Australian and New Zealand dollars, with the AUD/USD pair recovering toward $0.68 while the NZD/USD pair is surging above $0.6250.


Adding further pressure on the dollar, the yields on the 2-year and 10-year bonds also have fallen to intraday six-month lows of 3.65% and 3.30% respectively on expectations for lower rate hikes by Fed.

EUR/USD pair, Daily chart

The softening dollar has boosted other major peers, with EUR/USD pair posting higher highs above $1.07 and rolling toward the 1.08 psychological level.

Japanese Yen has added on last week’s gains, with the USD/JPY pair falling to nearly ¥131 level, its lowest since mid-February.

A similar story is shown on the antipodean currencies Australian and New Zealand dollars, with the AUD/USD pair recovering toward $0.68 while the NZD/USD pair is surging above $0.6250.


Following the recent negative sentiment for the greenback, the DXY-U.S. dollar index which tracks its value against six major peers fell to a monthly low of 103 level, much lower than its 2022’s high of 114, which hit at the end of September.

Adding further pressure on the dollar, the yields on the 2-year and 10-year bonds also have fallen to intraday six-month lows of 3.65% and 3.30% respectively on expectations for lower rate hikes by Fed.

EUR/USD pair, Daily chart

The softening dollar has boosted other major peers, with EUR/USD pair posting higher highs above $1.07 and rolling toward the 1.08 psychological level.

Japanese Yen has added on last week’s gains, with the USD/JPY pair falling to nearly ¥131 level, its lowest since mid-February.

A similar story is shown on the antipodean currencies Australian and New Zealand dollars, with the AUD/USD pair recovering toward $0.68 while the NZD/USD pair is surging above $0.6250.


Ahead of the FOMC decision on monetary policy on Wednesday, forex traders are leaning towards a 25-basis-point rate hike, with nearly 20% expecting a pause, as per CME Group’s Fedwatch tool, while the market expects rate cuts may begin in the summer.

Following the recent negative sentiment for the greenback, the DXY-U.S. dollar index which tracks its value against six major peers fell to a monthly low of 103 level, much lower than its 2022’s high of 114, which hit at the end of September.

Adding further pressure on the dollar, the yields on the 2-year and 10-year bonds also have fallen to intraday six-month lows of 3.65% and 3.30% respectively on expectations for lower rate hikes by Fed.

EUR/USD pair, Daily chart

The softening dollar has boosted other major peers, with EUR/USD pair posting higher highs above $1.07 and rolling toward the 1.08 psychological level.

Japanese Yen has added on last week’s gains, with the USD/JPY pair falling to nearly ¥131 level, its lowest since mid-February.

A similar story is shown on the antipodean currencies Australian and New Zealand dollars, with the AUD/USD pair recovering toward $0.68 while the NZD/USD pair is surging above $0.6250.


The collapse of the two U.S-based small (regional) banks of Silicon Valley and Signature, and the recent state-backed rescue of embattled lender Credit Suisse by rival UBS, have increased the odds of the Federal Reserve pausing hikes or raising rates at a slower pace on Wednesday.

Ahead of the FOMC decision on monetary policy on Wednesday, forex traders are leaning towards a 25-basis-point rate hike, with nearly 20% expecting a pause, as per CME Group’s Fedwatch tool, while the market expects rate cuts may begin in the summer.

Following the recent negative sentiment for the greenback, the DXY-U.S. dollar index which tracks its value against six major peers fell to a monthly low of 103 level, much lower than its 2022’s high of 114, which hit at the end of September.

Adding further pressure on the dollar, the yields on the 2-year and 10-year bonds also have fallen to intraday six-month lows of 3.65% and 3.30% respectively on expectations for lower rate hikes by Fed.

EUR/USD pair, Daily chart

The softening dollar has boosted other major peers, with EUR/USD pair posting higher highs above $1.07 and rolling toward the 1.08 psychological level.

Japanese Yen has added on last week’s gains, with the USD/JPY pair falling to nearly ¥131 level, its lowest since mid-February.

A similar story is shown on the antipodean currencies Australian and New Zealand dollars, with the AUD/USD pair recovering toward $0.68 while the NZD/USD pair is surging above $0.6250.


U.S. dollar falls across the board as investors have scaled back expectations for an aggressive 50-basis-point interest rate hike from the Federal Reserve at its March 22 monetary policy meeting following the recent turmoil in the banking and financial markets.

The collapse of the two U.S-based small (regional) banks of Silicon Valley and Signature, and the recent state-backed rescue of embattled lender Credit Suisse by rival UBS, have increased the odds of the Federal Reserve pausing hikes or raising rates at a slower pace on Wednesday.

Ahead of the FOMC decision on monetary policy on Wednesday, forex traders are leaning towards a 25-basis-point rate hike, with nearly 20% expecting a pause, as per CME Group’s Fedwatch tool, while the market expects rate cuts may begin in the summer.

Following the recent negative sentiment for the greenback, the DXY-U.S. dollar index which tracks its value against six major peers fell to a monthly low of 103 level, much lower than its 2022’s high of 114, which hit at the end of September.

Adding further pressure on the dollar, the yields on the 2-year and 10-year bonds also have fallen to intraday six-month lows of 3.65% and 3.30% respectively on expectations for lower rate hikes by Fed.

EUR/USD pair, Daily chart

The softening dollar has boosted other major peers, with EUR/USD pair posting higher highs above $1.07 and rolling toward the 1.08 psychological level.

Japanese Yen has added on last week’s gains, with the USD/JPY pair falling to nearly ¥131 level, its lowest since mid-February.

A similar story is shown on the antipodean currencies Australian and New Zealand dollars, with the AUD/USD pair recovering toward $0.68 while the NZD/USD pair is surging above $0.6250.


Gold rallies briefly above $2,000 on safety bets after banking uncertainty

The DXY- dollar index fell as low as 103.40 this morning, its lowest since mid-February, while the yield on the 2-year Treasury notes briefly retreated below 3.70%, making gold and silver more attractive for buyers with foreign currency.


The DXY- dollar index fell as low as 103.40 this morning, its lowest since mid-February, while the yield on the 2-year Treasury notes briefly retreated below 3.70%, making gold and silver more attractive for buyers with foreign currency.


Dollar-denominated and zero-yield gold has also got a boost from a softening U.S. dollar and bond yields, as investors expect that the recent banking crisis could cause Federal Reserve to pause or hike by a lower speed than initially expected, to avoid further pressure on the already fragile economic system.

The DXY- dollar index fell as low as 103.40 this morning, its lowest since mid-February, while the yield on the 2-year Treasury notes briefly retreated below 3.70%, making gold and silver more attractive for buyers with foreign currency.


Bullion extended last week’s strong gains on growing fear over the health of the U.S. banking sector despite the move by 11 major U.S. Banks to pledge a deposit totaling $30 billion of cash in the embattled First Republic Bank, to bolster confidence in the banking system, and to stop a spreading panic following a pair of recent bank failures.

Dollar-denominated and zero-yield gold has also got a boost from a softening U.S. dollar and bond yields, as investors expect that the recent banking crisis could cause Federal Reserve to pause or hike by a lower speed than initially expected, to avoid further pressure on the already fragile economic system.

The DXY- dollar index fell as low as 103.40 this morning, its lowest since mid-February, while the yield on the 2-year Treasury notes briefly retreated below 3.70%, making gold and silver more attractive for buyers with foreign currency.


A similar picture is seen on the other bullion, Silver, which its price climbed as high as $22,70/oz in the same period, before retreating to nearly $22/oz on the day.

Bullion extended last week’s strong gains on growing fear over the health of the U.S. banking sector despite the move by 11 major U.S. Banks to pledge a deposit totaling $30 billion of cash in the embattled First Republic Bank, to bolster confidence in the banking system, and to stop a spreading panic following a pair of recent bank failures.

Dollar-denominated and zero-yield gold has also got a boost from a softening U.S. dollar and bond yields, as investors expect that the recent banking crisis could cause Federal Reserve to pause or hike by a lower speed than initially expected, to avoid further pressure on the already fragile economic system.

The DXY- dollar index fell as low as 103.40 this morning, its lowest since mid-February, while the yield on the 2-year Treasury notes briefly retreated below 3.70%, making gold and silver more attractive for buyers with foreign currency.


Gold price, 1-hour chart

A similar picture is seen on the other bullion, Silver, which its price climbed as high as $22,70/oz in the same period, before retreating to nearly $22/oz on the day.

Bullion extended last week’s strong gains on growing fear over the health of the U.S. banking sector despite the move by 11 major U.S. Banks to pledge a deposit totaling $30 billion of cash in the embattled First Republic Bank, to bolster confidence in the banking system, and to stop a spreading panic following a pair of recent bank failures.

Dollar-denominated and zero-yield gold has also got a boost from a softening U.S. dollar and bond yields, as investors expect that the recent banking crisis could cause Federal Reserve to pause or hike by a lower speed than initially expected, to avoid further pressure on the already fragile economic system.

The DXY- dollar index fell as low as 103.40 this morning, its lowest since mid-February, while the yield on the 2-year Treasury notes briefly retreated below 3.70%, making gold and silver more attractive for buyers with foreign currency.


The price of gold rose as high as $2,014/oz early Monday morning, before retracing to below $1,980/oz on the day on improved risk sentiment and some profit-taking trades since it performed strongly during the last weeks.

Gold price, 1-hour chart

A similar picture is seen on the other bullion, Silver, which its price climbed as high as $22,70/oz in the same period, before retreating to nearly $22/oz on the day.

Bullion extended last week’s strong gains on growing fear over the health of the U.S. banking sector despite the move by 11 major U.S. Banks to pledge a deposit totaling $30 billion of cash in the embattled First Republic Bank, to bolster confidence in the banking system, and to stop a spreading panic following a pair of recent bank failures.

Dollar-denominated and zero-yield gold has also got a boost from a softening U.S. dollar and bond yields, as investors expect that the recent banking crisis could cause Federal Reserve to pause or hike by a lower speed than initially expected, to avoid further pressure on the already fragile economic system.

The DXY- dollar index fell as low as 103.40 this morning, its lowest since mid-February, while the yield on the 2-year Treasury notes briefly retreated below 3.70%, making gold and silver more attractive for buyers with foreign currency.


Gold shines once again, as its price briefly topped the $2,000 key level on Monday morning for the first time since early March 2022, as the domino collapse of Silicon Valley Bank, Signature Bank, and Credit Suisse fuelled worries of broader banking and financial instability and drove investors to the safety of the all-time haven yellow metal.

The price of gold rose as high as $2,014/oz early Monday morning, before retracing to below $1,980/oz on the day on improved risk sentiment and some profit-taking trades since it performed strongly during the last weeks.

Gold price, 1-hour chart

A similar picture is seen on the other bullion, Silver, which its price climbed as high as $22,70/oz in the same period, before retreating to nearly $22/oz on the day.

Bullion extended last week’s strong gains on growing fear over the health of the U.S. banking sector despite the move by 11 major U.S. Banks to pledge a deposit totaling $30 billion of cash in the embattled First Republic Bank, to bolster confidence in the banking system, and to stop a spreading panic following a pair of recent bank failures.

Dollar-denominated and zero-yield gold has also got a boost from a softening U.S. dollar and bond yields, as investors expect that the recent banking crisis could cause Federal Reserve to pause or hike by a lower speed than initially expected, to avoid further pressure on the already fragile economic system.

The DXY- dollar index fell as low as 103.40 this morning, its lowest since mid-February, while the yield on the 2-year Treasury notes briefly retreated below 3.70%, making gold and silver more attractive for buyers with foreign currency.