Natural gas and power prices retreat from record highs after Putin intervention

Global natural gas and power prices dropped nearly 10% on Thursday after Russian President Vladimir Putin announced that Gazprom would export more gas to Europe in November to ease an energy supply crunch ahead of the coming winter heating season.

Following a videoconference between President Putin and Gazprom Chief Executive Alexei Miller Russia’s president told the executive to start “gradually” filling its own natural gas underground storage facilities in Europe (Austria and Germany) from November 08, a day after it completes the gas filling in Russia.

The gas storages sites in Western and Central Europe are almost empty (due to a chilled 2020 winter season and unexpected low Russian supplies) at a time of year when they would normally be brimming.


Market reaction:

The report for that long-awaited additional gas supplies from Russia was a bearish catalyst for the global gas and power prices as it should ease supply tightness in Europe, where surging power prices boost inflationary pressure.

The U.S-based Henry Hub Natural Gas benchmark lost nearly 8% yesterday with the price breaking below the $6 support level, settling to near to $5,50/MMBtu.

Similar picture on the rest of gas prices around the world, with the UK and Dutch natural gas benchmarks losing nearly 10%, while the Asia-based LNG Japan/Korea marker futures tumbling 5% as well.

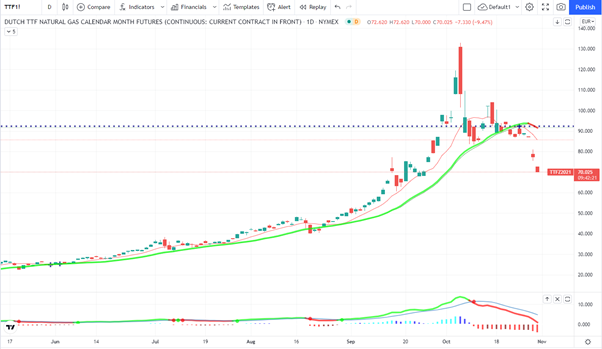
Europe-wide natural gas benchmark “Dutch TTF” gas futures (The Title Transfer Facility, more commonly known as TTF, is a virtual trading point for natural gas in the Netherlands) fell to as low as 70 euros per megawatt-hour (MWh), losing more than 20% since Monday and almost 50% since topping €130/MWh record high on October 06.

Dutch TTF gas futures, Daily chart


Dutch TTF gas benchmark has a mirror effect with the electricity prices in Europe since natural gas has been the major contributor to EU power production, being the second largest source for electricity generation in 2020 with 23%, after nuclear power with 26%.

Tesla became the first car maker to reach a $1T market cap

The world’s leading electric vehicle (EV) maker Tesla crossed the $1 trillion market capitalization level for the first time on Monday following the announcement from the rental car operator Hertz for an order of 100,000 Tesla’s Model 3 sedans, in the first step of an ambitious plan to electrify its rental-car fleet.

Tesla became the sixth U.S. company to close above the $1 trillion milestones after the tech giants Apple, Microsoft, Alphabet, Amazon, and Facebook, and the first automaker to achieve this.

Shares of Tesla finished the first trading session of the week with nearly 13% gains, settling to a record $1,024 and pushing company’s market value past $1 trillion for the first time.

This is a bullish catalyst not only for Tesla but for the whole EV auto industry since Hertz’s order is the single-largest purchase ever for EVs-electric vehicles.

As a result, the shares of some top EV automakers such as the Chinese NIO, XPENG, LI, BYD, and others jumped between 5%-10% on Monday, gaining support from the overall bullish sentiment and positive EV market outlook.

Additionally, Tesla shares received a further boost after the company reported sales of $3,11 billion in China in Q3, 2021, or nearly 50% of the $6,5 billion U.S. sales during the same period.

Let’s remind that Tesla made a strategic movement to build and operate a Gigafactory in Shanghai since China has been the world’s largest auto market and a top selling market for the well-known traditional automakers such as VW, and Toyota.

Elon Musk’s EV company has started delivering the first China-made Tesla models 3 and Y since early 2020, which have become very popular among local customers.


Hertz order for 100,000 EVs shakes up the global auto industry:

According to Hertz Global Holdings Inc. statement, the company placed an order for 100,000 Tesla’s Model 3 sedans to be delivered over the next 14 months, while the first Tesla will be available to rent at Hertz locations in major U.S. markets and parts of Europe starting in early November.

On top of that, customers will have access to Tesla’s network of superchargers, while Hertz will also build its charging infrastructure very soon.

Commodity currencies hit multi-month highs on surging energies and metals

The top three commodity currencies Australian, Canadian, and New Zealand dollars have reached levels that haven’t been seen since early July, as energy and base metal prices hit their highest levels in many years, while major peers such as the U.S dollar, Japanese Yen and Euro have dropped to monthly lows.

The currencies of top commodity exporters usually enjoy support from the market’s expectations for additional gains in the price of major energy commodities such as crude oil, coal, and natural gas, together with gains in top construction and manufacturing commodities such as copper, iron ore, aluminium, and others.


Commodities rally across the board in 2021:

Crude oil prices continue their bullish upward momentum with the price of Brent crude breaking above $86/b, while the U.S-based WTI oil re-approached $85/b resistance level after 7 years, amid strong global demand for petroleum products as economies reopen after the pandemic-led lockdowns, while the market remains well undersupplied.

On top of that, the major industrial metals have hit multi-year highs, with the price of Copper rallying towards $4,80/lb, Aluminum hit $3,200/t level on robust demand and supply disruptions, while the price of Iron Ore climbed to $220/t before retreating towards $120/t.


Commodity currencies outperform major peers:

Based on the bullish market dynamics, the Canadian dollar soared to as high as C$1.23 per U.S. dollar on October 21, posting a four-month high following the higher-than-expected Canadian inflation data and the surging energy and metal prices.

The major Antipodeans currencies Australian and New Zealand dollars have also rallied towards 4-month highs following the soaring crude oil, coal, copper, and agricultural commodities prices, while investors increased bets as they expect their central banks to start hiking interest rates in 2022 to tackle the inflationary pressure.

AUD/USD pair, Daily chart


Aussie soared to $0,75 against the U.S dollar from the lows of $0,715 during September and ¥85,15 to Japanese Yen, while the Kiwi reclaimed $0,72 and ¥82 respectively.


Dollar weakness boosts commodity currencies:

The recent softness of the U.S dollar is also benefiting the commodity currencies since most of the commodities are denominated in the U.S dollar, making them cheaper for foreign buyers in case of dollar weakness.

The “DXI” the U.S dollar index against six major peers fell to as low as 93,50 on Monday morning, its lowest level since late September, as investors weigh the effect of inflation on the relative pace of looming rate hikes.

Bitcoin tops $60,000 as SEC will allow the first Bitcoin ETFs

The world’s leading digital currency rallied towards $60,000 key psychological level during early Friday’s trading session, spurred by the news that the US Securities and Exchange Commission (SEC) is ready to approve the launch of the first U.S Bitcoin futures Exchange Traded Funds (ETFs) as soon as early next week.

BTC/USD pair, Daily chart


Bitcoin posted a remarkable recovery rally from September’s lows of $40,000 towards the $60,000 key level, gaining nearly 50% amid strong buys from long-term crypto investors, the liquidation of more than $300 million worth of short positions in the market, and from speculators that follows the market momentum.

The pioneer cryptocurrency has proven doubters wrong after it managed to halt the downward trend at the $30,000 level in mid-July following China’s crypto mining crunch. Most of the crypto miners have moved to the U.S. and especially to the mining-friendly Texas state, while some others work from Kazakhstan and Iceland amid low-cost mining.

An additional boost to the crypto rally gave the U.S. Federal Reserve Chair Jerome Powell last month after he said that the most powerful central bank in the world has no intention of banning cryptocurrencies.


Mainstream adoption:

Cryptocurrency investors cheered the significant progress around the first Bitcoin ETF in the United States, as the launch has been well-expected during the last quarter of the year, following the launch of crypto ETFs in Europe and Canada months ago.

SEC’s approval could speed up the mainstream adoption and will allow big Wall Street investment banks and other institutional investors to offer exposure in the crypto market to their clients through regulated Bitcoin ETF’s.

On top of that, many institutional money managers, including the Cathy Wood’s Ark Fund, VanEck Bitcoin Trust, ProShares, Invesco, Valkyrie, and Galaxy Digital Funds have applied to launch bitcoin ETFs in the United States.


Turkish lira hits fresh record low of $9,20 after Erdogan dismissed central bankers

The high-yielding Turkish lira hits a fresh record low of $9,20 against the U.S. dollar and €10,65 to Euro on Thursday’s trading session after President Recep Tayyip Erdogan dismissed three central bank monetary policy committee (MPC) members on early Thursday, appointing two new members in their place.

USD/TRY pair, Weekly chart


President Erdogan ordered the dismissal of the only hawkish member of the monetary policy committee Mr. Ugur Namik Kucuk, after the overnight meeting with the dovish Turkish central bank’s governor Sahap Kavcioglu.

Mr. Kucuk had made the mistake to insist on his orthodox monetary opinion to tackle elevating local inflation rates by opposing August’s interest rate cut (ordered by President Erdogan), and to go against the contentious policy of selling off the central bank’s foreign currency reserves to halt the downward momentum of the lira.

The financial world was surprised by the 1% cut of the bank’s benchmark rate in August to 18% at a time when annual inflation was climbing at 19%. Forex traders expect further rate cuts would come soon following the banker’s firings, fuelling additional currency losses, and strengthening local inflation rates.

As a result, foreign and local investors moved away from the Turkish lira-denominated assets, sending the local stock market index in deep red and exchanging the depreciating Turkish lira with harder currencies such as the world reserve currency U.S. dollar, the Euro, or even preferring digital currencies, especially Bitcoin.

Investors have lost their faith on Turkish economy following Erdogan’s numerous interventions on central bank’s monetary policies, the removals of the last three governors since 2019, and the unstoppable rise of food and energy inflation in the country.


Don’t judge a market by its major indices

While on the surface it seems that markets are doing just fine, there has been a lot of damage done when looking under the surface of the major indices. To begin with, the S&P 500 is not the 500 anymore, but more like the S&P 7. This because the first 7 largest companies of the index comprise over 30% of the market cap of the index. And when we go to the top 50 companies, the market cap is over 50%. This means that while these companies might have double digit gains in many cases, the rest of the market (the other 450 stocks) might be down, and in many cases by a lot.

One chart that is interesting is the number of stocks above their 200 day moving average.

As you can see from the chart, that number is about 62% and falling. In fact, this despite indices being at record high. Almost all breath indicators that I look at are at their low for the year, which generally is not a good thing. But an even more indicative chart of the situation is the highly talked about ARK innovation ETF.

Not only is it down for the year, but it is also down about 30% from its highs of mid-February, which is where most stocks peaked for the year. Yes, there are many opportunities in this market, this because many stocks have been beaten down to scrap levels. At the same time however, it seems that we are entering a risk off faze, judging by the breath indicators that I see.

The bottom-line is don’t judge a market by its major indices, because many times what is actually going on, is not indicative of what the indices tell us.