Commodity inflation worries central bankers

Inflation and a broad-based commodities boom have been in the spotlight and the hot topic of investors and central bankers lately since costs will begin to impact households and vulnerable businesses.

Prices of energy, metals, and agricultural raw materials have been posting an upward momentum since the start of the year. This was driven by a stronger-than-expected global consumption, supply shortage, logistics logjam, and due to massive monetary and fiscal stimulus.

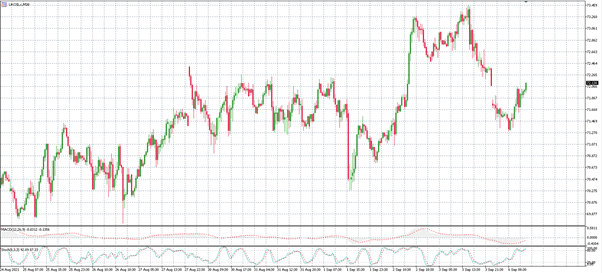
Crude oil, the world’s most crucial commodity, has gained more than 50% this year, rallying towards 70 dollars a barrel, due to the OPEC+ alliance production cuts, and recovering demand for petroleum products.

The post-pandemic recovery of the global manufacturing and construction sectors has boosted demand for industrial raw materials, such as copper, aluminium, iron ore, cotton, lumber, and natural rubber, sending their prices to record highs.

Agricultural commodities such as corn, wheat, soybeans, sugar, and coffee have also hit multi-year highs, whilst the price of natural gas has doubled this year, with additional costs incurred on electricity bills. 

The sky-high commodity prices have gained the attention of central bankers since inflation in the US and Eurozone exceeded the central bank’s target of 2% in August. 

Despite the fact that the Federal Reserve believes inflationary pressure will be transitory, other central banks and economists believe inflation will persist and therefore they should start tapering their accommodative monetary policies.

Next stop – The Forex Expo Dubai

We are delighted to announce that Exclusive Capital will be exhibiting at the Forex Expo Dubai held on 29-30 of September and support the event as Platinum Sponsor.

As our company grows forward, with a continuously expanding product range and various industry veterans recently joining our team in senior-level positions, we are looking forward to sharing our upgraded offering, meet industry professionals and gain new and meaningful connections.

At Exclusive Capital we are currently actively working on the company’s expansion and growth in Dubai, the Middle East & North Africa region, continuing to empower more people to achieve their investment goals through sustainable growth. We believe that our Multi-Asset Liquidity Offering, Professionally Curated Investment Strategies, Full Financial Brokerage Solution, and the newest addition of Fractional Stock Trading offers a diverse range of services to help clients invest, manage, and grow their wealth with confidence.

We will be happy to meet in person at the Forex Expo Dubai at Booth No. 80 & Business Lounge.

Is the Force with risk assets?

COVID, inflation, deflation, global growth prospects, interest rates and a bunch of other things that I could probably write a book about, all worry me. However, all the above aside, the thing that mostly worries me above all others is the value of the dollar.

Taking a cue from Star Wars, the dollar is something like the force. When there is balance in the force, things work ok, and the galaxy is peaceful. But when there is a disturbance in the force, then all hell breaks loose.

Similarly, when the dollar’s value is balanced, the global economy is growing, and things are moving alone ok. But when the dollar becomes strong, then things don’t work so well. A strong dollar means there are fewer dollars available for the global economy to function properly. It also means companies and countries that have dollar denominated debts must pay more. But it might also mean a headwind for US companies that rely for a big portion of their profitability from global markets.

A higher dollar might also mean market participants are buying dollars as a safe haven trade. And every time this happens, it does not fare well for equities.

So, if we look at the chart above, one can probably say that as long as the EURUSD pair remains above 1.17, risk assets should continue to do well. But if the pair falls and remains below 1.17, then chances are we might see correction.

On the other hand, if we see the pair above 1.22, then chances are risk assets will continue to perform well, and we might see a strong upward move in equities.

The bottom line is that there are countless things that worry me, and countless things that can cause a correction in the equity space. However insofar as the dollar, if it remains at current levels, it will be one less thing to worry about. And if we see the EURUSD pair above 1.22, then we can say with a little more confidence that the Force will continue to be with risk assets.

Brent oil falls 1% after Saudi’s Aramco cuts prices to Asian customers

Crude oil prices fall 1% across the board on Monday, after the de-facto leader of OPEC group, Saudi Arabia, cut its prices of all crude grades to Asian customers for October amid bearish demand outlook for the region, while leaving prices to Europe and the United States steady.

The worlds’ largest oil company Saudi Aramco cut the official selling price of its main crude grade “Arab Light” by $1,70/barrel lower than its Dubai/Oman benchmark over the weekend, which has been the largest price cut since the start of 2021.

Global crude demand outlook has recently deteriorated, after China, the second largest oil importer in the world, had resumed social restriction measures or lockdowns to some parts of the country during August to control the spread of the highly transmissible “Delta” covid variant.

However, Saudi Aramco left its differentials for cargoes to European and North American customers unchanged since the demand dynamics in those areas are much better than in China and other parts of Asia-Pacific (its biggest buying region).

Prices have also corrected from their monthly highs since the OPEC group and its allies led by Russia, known as the OPEC+ alliance, decided to raise their output by 400,000 barrels per day each month between August until the end of 2021.

Market reaction:

The higher-than-expected price cut by Saudi Aramco triggered a selling pressure on the crude oil contracts during the opening bell in Sunday’s Asian trading session.

Brent crude, 30-minutes chart

As a result, the price of the international oil benchmark Brent retreated by more than 1% from last week’s highs to as low as $71.50/barrel before bounces back to $72/barrel, while U.S. crude also lost 1.5% to $68.50/barrel.

Ethereum re-approaches $4,000 on NFT’s frenzy, Bitcoin tops $50,000

Ethereum posts a massive uptrend rally re-approaching the $4,000 psychological level for the first time since mid-May, while Bitcoin attempts to break above $50,000 key resistance level driven by the renewed frenzy in the NFTs space, more institutional adoption, while the worries over China’s mining regulatory pressure have eased.

Ethereum skyrockets from NFT’s and DeFi frenzy:

Ethereum has made significant gains in the last six weeks rising by more than 120%. It’s market cap has approached $440 billion or 20% of the total value of the cryptocurrency market, which has now reached $2.3 trillion.

ETH/USD, Daily chart

Investors are excited for the bullish outlook of the second largest cryptocurrency since its gaining support from the latest surging demand for NFTs and DeFi apps.

Transactions of NFTs (Non-Fungible Tokens) are usually settled in Ether, the token of Ethereum Blockchain that hosts the transactions, creating demand from buyers as prices of NFTs continue to climb and spread.

August’s NFT market volume currently weighs at $2.3 billion mainly on OpenSea space, which is 10 times more than July’s volumes of just $300 million

Another important bullish catalyst is the high volume of Ethereum. Of the total trading volume of $160 billion in all cryptocurrencies, Ethereum’s trading volume in the last 24 hours was approximately $35 billion.

Bitcoin attempts to break above $50,000:

Meanwhile, Bitcoin, the world’s largest digital currency, attempts to break through the $50,000 psychological level. Doing so is likely to trigger a fresh rally towards the next important level at $60,000 and eventually to retests the all-time high of $65,000 posted on April 14, 2021.

BTC/USD, Daily chart

Bitcoin holds 40% of the total crypto capitalization, with its market cap being very close to one trillion dollars ($941.6 billion).

Let’s remind that Bitcoin hit yearly lows at $29,000 on July 20 amid China’s regulatory crackdown on crypto mining and Tesla’s Elon Musk environmental-led comments, before starting an upswing rally towards $50,000 level on improved bullish sentiment and fresh buying “mania” from retail and institutional investors.

Global equities hit fresh records ahead of key NFP jobs report

Global equities started September in a positive mood, carrying the bullish momentum from August despite continued concerns over persistently high Delta Covid variant cases worldwide.

US stock indices posted multiple records in August, with the tech-heavy Nasdaq Composite outperforming the market by adding 4%, as investors piled back into growth and technology stocks.

The S&P 500 rose 3% for the month, lifted by strong second-quarter earnings, ongoing global economic recovery, reopening trades, and by a very accommodative Federal Reserve despite worries about inflationary pressure.

European indices have started the month with a 1% rise, holding just below their record highs, led by stocks that benefit from the economic reopening like retailers, airlines, and financials, despite the surge of euro zone’s inflation to a 10-year high of 3% in August.

Meanwhile, Asian-Pacific equities managed to recover from monthly lows as weaker economic data, higher raw material prices, and shipping costs were offset by hopes of more stimulus from central banks.

Asia’s economic activity lost momentum in August as a resurgence in coronavirus cases disrupted factory production and supply chains across the region, raising concerns over the economic recovery after the pandemic.

Market participants are now focused on August U.S. nonfarm payrolls data, which is scheduled to be released on Friday, for insight into the possible path of the Federal Reserve’s monetary policy.

A high print should see a tapering reaction in markets, while a weaker print will see Fed delaying its tapering for a few months.