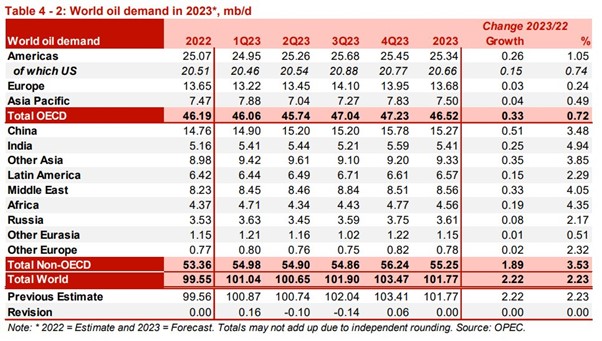
The above table from OPEC indicates that most of the oil demand growth in 2023 will come from OECD regions (developed countries) due to a weak macroeconomic outlook, but it will come from the non-OECD regions (emerging markets), especially from China, Middle East, and India.
Tight supplies in 2023:
Russia will be a wild card on global oil supplies:
Russia’s invasion of Ukraine in late February 2022 shocked energy markets and the world economy. It has transformed oil, gas, and electricity markets, created 40-year record-high inflation, and triggered food insecurity while adding to the geopolitical landscape risk.
Western allies, including the Group of Seven (G7) major powers, the European Union, the UK, and Australia agreed to a $60/b price cap (banning Western companies from insuring, financing, or shipping Russian crude at above $60 a barrel) on Russian seaborne crude oil effective from December 05, 2022, over Moscow’s invasion of Ukraine.
Hence, the EU countries have separately implemented an embargo that prohibits them from purchasing seaborne Russian oil (Dec. 05, 2022) and oil refined products (Feb.05, 2023), aimed at paralyzing Russian state resources and Moscow’s military efforts in Ukraine.
In retaliation to the Western sanctions, Russian President Vladimir Putin banned the supply of crude oil and oil products from February 01, 2023, for five months to nations that abide by the cap.
Russia is the world’s second-largest oil exporter after Saudi Arabia with nearly 10 million barrels per day output, and a major disruption to its sales would have far-reaching consequences for global energy supplies into 2023.
However, we don’t expect the Western curbs on Russian crude sales to affect Moscow’s ability to sell the cargo in the global markets as there are plenty of countries such as China, India, and Turkey that are willing to buy the sanctioned oil in deep discounts, directly or through intermediaries. Russian Ural crude still flows to Chinese, Turkish, and Indian buyers (refiners) at below the G7’s $60/b price cap (on a range between $45-$59 a barrel).
OPEC+ pricing power:
In October 2022, the OPEC+ alliance slashed its collective output by 2 million bpd until the end of 2023 on concerns that a potential global economic slowdown could hit hard the global oil demand growth.
OPEC’s pricing power, and especially those of the de facto leader Saudi Arabia weighted significantly on the falling oil prices which had fallen as low as $70/b that time, suggesting that it put a “price limit” on the downside risks to our bullish oil forecast.
The group will still face challenges to keep oil markets higher in 2023 as most members might need to slash further the selling price of their oil benchmarks to lows not seen since 2021. The low prices would be necessary to maintain their barrels attractive for Asian customers amid persistent discounting on Russian oil after the G7 price cap of $60 per barrel on seaborne Russian crude, and the EU embargo on Russian oil exports following the Ukraine invasion.
Global economic downward pressure:
Recession fears are weighing on crude oil prices with the IMF-International Monetary Fund warning about a likely global recession in 2023 amid economic slowdowns in the world’s three main growth-driving regions of the United States, Europe, and China which could limit fuel demand.
The manufacturing activity has contracted around the world, especially in the industrial centres of Central Europe (Germany, France) and in the United States due to surging energy and raw material costs, while Chinese industrial activity shrank for a fifth straight month in December (reference link?) due to an unprecedented spike in coronavirus cases.
The 40-year record-high inflation numbers (reference link?) and the skyrocketing interest rates have damaged the purchasing power of the households (reference link?), and could next hit their consumption sentiment, which would eventually create a slowdown in global economic growth and hit hard the oil demand.
On top of that, we are concerned that the massive flow of Chinese travellers during the Lunar New Year season and students around the world could cause another surge in COVID infections at a time the global economies are still struggling with the energy crisis and inflation.
Central banks, inflation, and rate hikes:
We expect some of the major central banks such as the Federal Reserve, ECB, and BoE to temper their hawkish rhetoric and proceed with a slowing of interest rate hikes in the coming months amid growing signs that record-high inflation is easing.
Especially, the prospect of a less hawkish Federal Reserve, which weighs on the U.S. dollar, is expected to provide much relief to dollar-denominated crude oil prices, after a sharp rise in rates battered energy markets in 2022. A strong dollar makes the dollar-priced oil more expensive for buyers with foreign currency, and the opposite.
But given that inflation is still trending well above their annual target range of 2%, the policymakers are broadly expected to keep monetary policy tight until mid-2023, and will likely maintain high-interest rates for longer, before easing between end of the year and early 2024
The Federal Reserve policy terminal rate is currently expected to rise to a 5% to 5.25% range to bring higher inflation rates under control, nearly 1% higher than the current rate range of 4.25% to 4.5%. But persisting price pressures on high service fees and food costs will undermine the normalization to recovery.
Fresh inflation data during the next weeks will help central banks to decide whether they can slow the pace of interest rate hikes at their upcoming meetings, from staying the course of half a point to just a quarter-point increase instead of even larger hikes they used for most of 2022.
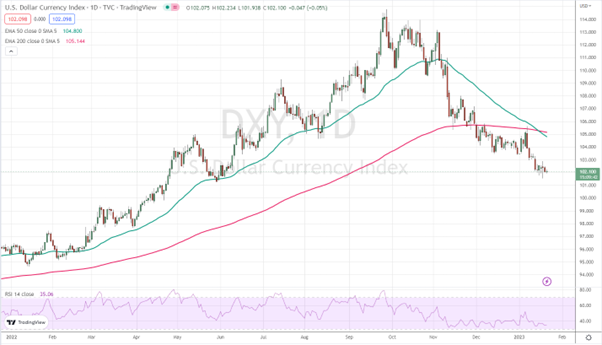
A weaker U.S. dollar ahead?
The U.S. dollar will be another wildcard for the dollar-denominated crude oil prices in the following months.
The greenback has tumbled in recent weeks on hopes that the Federal Reserve will hike interest rates at a slower pace in the near term amid increasing economic indications that U.S. inflation is easing.
Evidence of the latter include a falling Consumer Price Index and Producer Price Index, weaker retail sales, economic activity easing, labour market about to cool, a moderation in wage increases, and a further decline in new housing permits and starts.
The downtrend momentum of the greenback in December helped oil prices to rebound from their yearly lows of $70s/b to nearly $85/b, as the 2022’ dollar strength seems to have run out of steam due to a less hawkish Federal Reserve.
Closing Thoughts:
Despite the growing possibility of a global recession, a lower industrial and trade activity, high interest rates, and record-high inflation, we maintain our bullish outlook on crude oil prices for the Q1, 2023 driven by expectations for a sizeable rebound in oil demand in China, the resilience of the U.S. economy, a softer-than-expected global recession, and a weaker dollar.
Crude oil prices came under pressure in the last quarter of 2022, falling to levels not seen since before Russia’s invasion of Ukraine on February 24, 2022.
Brent dropped as low as $75/b and WTI to $70/b in early December, losing nearly 45% since topping at $140/b in early March, as sentiment was dented by growing concerns over a potential economic recession driven by rising interest rates due to a surging inflation, coupled with worries over rising Covid-19 cases in China.
Bullish Q1, 2023 Outlook:
Base scenario: Brent crude oil prices to trade on an average of $90/b in Q1, 2023
We remain bullish on the crude oil sector as we expect Brent (the benchmark for two thirds of the world’s oil) prices to trade on an average of $90 a barrel in the first quarter of the year based on the mismatch of the demand-supply oil dynamics.
We forecast a significant rebound in gasoline and jet fuel demand from the gradual reopening of Chinese economy (the world’s biggest crude importer), and a robust fuel demand growth from India, and North America over the course of next three months (according to OPEC), offsetting any weakening oil demand growth in Europe due to falling economic activity and recession fears.
Bullish scenario: Brent crude oil prices to break above the $100/b key psychological level
Our bullish case scenario assumes Brent oil prices to break above $100/b key psychological level and climb up to $110/b until the end of Q1, 2023 as global oil supply will not meet soaring demand.
The bullish scenario is based on the optimism over China’s move to reopen its borders for the first time in three years, a possible stronger-than-expected post-reopening economic recovery phase in China, the softening U.S. dollar, and the less aggressive increases to U.S. interest rates will boost the outlook for fuel demand and will overshadow global recession concerns.
Bearish scenario: Oil prices to break below the $70 a barrel key support level:
Our bearish scenario assumes Brent oil prices to break below $70/b key support level in case the global supply will outstrip a weakening demand.
The bearish scenario assumes of a lower-than-expected oil and energy consumption in case fresh Covid outbreak-flare-ups in China spread, Russian supply resilience amid a minimal impact of Western sanctions on Russian oil, a mild winter in the Northern Hemisphere, a persistent record-high inflation, and more aggressive rate hikes by central banks.
Market catalysts that impact the oil price dynamics:
China’s Covid policy U-turn:
In the energy universe, crude oil investors are always ultra-sensitive to anything that might happen in China, since the Asian dragon is the world’s largest petroleum-importing nation and second-largest consumer (after the USA).
China is preparing for a U-turn from its zero-Covid policy and the reopening of its economy and international borders after 2.5 years of isolation. The U-turn is raising hopes for a stronger-than-expected post-reopening economic recovery, as the country has been largely shut off from the world since the pandemic began in early 2020.
Hence, the relaxing of most anti-Covid measures, the reopening of its international borders, and the easing of Covid-related travel restrictions in 2023 will have a positive implication for global aviation, as the full recovery of China’s tourism and traveling for business and studying abroad will boost the demand for jet fuels and gasoline.
We also expect that the Lunar New Year (end of January) would be a supportive catalyst for oil prices since the demand for petroleum products in China typically rises every year during that period.
Overall, the faster-than-expected shift in Covid policy means that the domestic fuel demand recovery could be larger than initially forecasted, boosting the expected China’s oil consumption to a record of nearly 16 million bpd in the end of 2023, up nearly a million from last year.
Robust global oil demand growth in 2023:
Our bullish outlook will be supported by an expected solid growth in global crude oil demand in 2023, of which 50% will be driven by a demand rebound from China.
Goldman Sachs expects global oil demand to grow by 2.7 million bpd until the end of the year, ING expects a growth by around 1.7 million bpd for the same period,
The International Energy Association (IEA) monthly Oil Market Report (OMR) lifted its 2023 oil demand growth forecast by 1.9 million bpd to 101.7 million bpd, an upgrade from its from 1.7 million bpd forecasted in December.
China reopening is driving the optimism over a supportive petroleum demand growth outlook on expectations that the half of the new global demand will come from China, as more people will start driving and traveling around the world.
The above table from OPEC indicates that most of the oil demand growth in 2023 will come from OECD regions (developed countries) due to a weak macroeconomic outlook, but it will come from the non-OECD regions (emerging markets), especially from China, Middle East, and India.
Tight supplies in 2023:
Russia will be a wild card on global oil supplies:
Russia’s invasion of Ukraine in late February 2022 shocked energy markets and the world economy. It has transformed oil, gas, and electricity markets, created 40-year record-high inflation, and triggered food insecurity while adding to the geopolitical landscape risk.
Western allies, including the Group of Seven (G7) major powers, the European Union, the UK, and Australia agreed to a $60/b price cap (banning Western companies from insuring, financing, or shipping Russian crude at above $60 a barrel) on Russian seaborne crude oil effective from December 05, 2022, over Moscow’s invasion of Ukraine.
Hence, the EU countries have separately implemented an embargo that prohibits them from purchasing seaborne Russian oil (Dec. 05, 2022) and oil refined products (Feb.05, 2023), aimed at paralyzing Russian state resources and Moscow’s military efforts in Ukraine.
In retaliation to the Western sanctions, Russian President Vladimir Putin banned the supply of crude oil and oil products from February 01, 2023, for five months to nations that abide by the cap.
Russia is the world’s second-largest oil exporter after Saudi Arabia with nearly 10 million barrels per day output, and a major disruption to its sales would have far-reaching consequences for global energy supplies into 2023.
However, we don’t expect the Western curbs on Russian crude sales to affect Moscow’s ability to sell the cargo in the global markets as there are plenty of countries such as China, India, and Turkey that are willing to buy the sanctioned oil in deep discounts, directly or through intermediaries. Russian Ural crude still flows to Chinese, Turkish, and Indian buyers (refiners) at below the G7’s $60/b price cap (on a range between $45-$59 a barrel).
OPEC+ pricing power:
In October 2022, the OPEC+ alliance slashed its collective output by 2 million bpd until the end of 2023 on concerns that a potential global economic slowdown could hit hard the global oil demand growth.
OPEC’s pricing power, and especially those of the de facto leader Saudi Arabia weighted significantly on the falling oil prices which had fallen as low as $70/b that time, suggesting that it put a “price limit” on the downside risks to our bullish oil forecast.
The group will still face challenges to keep oil markets higher in 2023 as most members might need to slash further the selling price of their oil benchmarks to lows not seen since 2021. The low prices would be necessary to maintain their barrels attractive for Asian customers amid persistent discounting on Russian oil after the G7 price cap of $60 per barrel on seaborne Russian crude, and the EU embargo on Russian oil exports following the Ukraine invasion.
Global economic downward pressure:
Recession fears are weighing on crude oil prices with the IMF-International Monetary Fund warning about a likely global recession in 2023 amid economic slowdowns in the world’s three main growth-driving regions of the United States, Europe, and China which could limit fuel demand.
The manufacturing activity has contracted around the world, especially in the industrial centres of Central Europe (Germany, France) and in the United States due to surging energy and raw material costs, while Chinese industrial activity shrank for a fifth straight month in December (reference link?) due to an unprecedented spike in coronavirus cases.
The 40-year record-high inflation numbers (reference link?) and the skyrocketing interest rates have damaged the purchasing power of the households (reference link?), and could next hit their consumption sentiment, which would eventually create a slowdown in global economic growth and hit hard the oil demand.
On top of that, we are concerned that the massive flow of Chinese travellers during the Lunar New Year season and students around the world could cause another surge in COVID infections at a time the global economies are still struggling with the energy crisis and inflation.
Central banks, inflation, and rate hikes:
We expect some of the major central banks such as the Federal Reserve, ECB, and BoE to temper their hawkish rhetoric and proceed with a slowing of interest rate hikes in the coming months amid growing signs that record-high inflation is easing.
Especially, the prospect of a less hawkish Federal Reserve, which weighs on the U.S. dollar, is expected to provide much relief to dollar-denominated crude oil prices, after a sharp rise in rates battered energy markets in 2022. A strong dollar makes the dollar-priced oil more expensive for buyers with foreign currency, and the opposite.
But given that inflation is still trending well above their annual target range of 2%, the policymakers are broadly expected to keep monetary policy tight until mid-2023, and will likely maintain high-interest rates for longer, before easing between end of the year and early 2024
The Federal Reserve policy terminal rate is currently expected to rise to a 5% to 5.25% range to bring higher inflation rates under control, nearly 1% higher than the current rate range of 4.25% to 4.5%. But persisting price pressures on high service fees and food costs will undermine the normalization to recovery.
Fresh inflation data during the next weeks will help central banks to decide whether they can slow the pace of interest rate hikes at their upcoming meetings, from staying the course of half a point to just a quarter-point increase instead of even larger hikes they used for most of 2022.
A weaker U.S. dollar ahead?
The U.S. dollar will be another wildcard for the dollar-denominated crude oil prices in the following months.
The greenback has tumbled in recent weeks on hopes that the Federal Reserve will hike interest rates at a slower pace in the near term amid increasing economic indications that U.S. inflation is easing.
Evidence of the latter include a falling Consumer Price Index and Producer Price Index, weaker retail sales, economic activity easing, labour market about to cool, a moderation in wage increases, and a further decline in new housing permits and starts.
The downtrend momentum of the greenback in December helped oil prices to rebound from their yearly lows of $70s/b to nearly $85/b, as the 2022’ dollar strength seems to have run out of steam due to a less hawkish Federal Reserve.
Closing Thoughts:
Despite the growing possibility of a global recession, a lower industrial and trade activity, high interest rates, and record-high inflation, we maintain our bullish outlook on crude oil prices for the Q1, 2023 driven by expectations for a sizeable rebound in oil demand in China, the resilience of the U.S. economy, a softer-than-expected global recession, and a weaker dollar.
Market reaction in Q4, 2022:
Crude oil prices came under pressure in the last quarter of 2022, falling to levels not seen since before Russia’s invasion of Ukraine on February 24, 2022.
Brent dropped as low as $75/b and WTI to $70/b in early December, losing nearly 45% since topping at $140/b in early March, as sentiment was dented by growing concerns over a potential economic recession driven by rising interest rates due to a surging inflation, coupled with worries over rising Covid-19 cases in China.
Bullish Q1, 2023 Outlook:
Base scenario: Brent crude oil prices to trade on an average of $90/b in Q1, 2023
We remain bullish on the crude oil sector as we expect Brent (the benchmark for two thirds of the world’s oil) prices to trade on an average of $90 a barrel in the first quarter of the year based on the mismatch of the demand-supply oil dynamics.
We forecast a significant rebound in gasoline and jet fuel demand from the gradual reopening of Chinese economy (the world’s biggest crude importer), and a robust fuel demand growth from India, and North America over the course of next three months (according to OPEC), offsetting any weakening oil demand growth in Europe due to falling economic activity and recession fears.
Bullish scenario: Brent crude oil prices to break above the $100/b key psychological level
Our bullish case scenario assumes Brent oil prices to break above $100/b key psychological level and climb up to $110/b until the end of Q1, 2023 as global oil supply will not meet soaring demand.
The bullish scenario is based on the optimism over China’s move to reopen its borders for the first time in three years, a possible stronger-than-expected post-reopening economic recovery phase in China, the softening U.S. dollar, and the less aggressive increases to U.S. interest rates will boost the outlook for fuel demand and will overshadow global recession concerns.
Bearish scenario: Oil prices to break below the $70 a barrel key support level:
Our bearish scenario assumes Brent oil prices to break below $70/b key support level in case the global supply will outstrip a weakening demand.
The bearish scenario assumes of a lower-than-expected oil and energy consumption in case fresh Covid outbreak-flare-ups in China spread, Russian supply resilience amid a minimal impact of Western sanctions on Russian oil, a mild winter in the Northern Hemisphere, a persistent record-high inflation, and more aggressive rate hikes by central banks.
Market catalysts that impact the oil price dynamics:
China’s Covid policy U-turn:
In the energy universe, crude oil investors are always ultra-sensitive to anything that might happen in China, since the Asian dragon is the world’s largest petroleum-importing nation and second-largest consumer (after the USA).
China is preparing for a U-turn from its zero-Covid policy and the reopening of its economy and international borders after 2.5 years of isolation. The U-turn is raising hopes for a stronger-than-expected post-reopening economic recovery, as the country has been largely shut off from the world since the pandemic began in early 2020.
Hence, the relaxing of most anti-Covid measures, the reopening of its international borders, and the easing of Covid-related travel restrictions in 2023 will have a positive implication for global aviation, as the full recovery of China’s tourism and traveling for business and studying abroad will boost the demand for jet fuels and gasoline.
We also expect that the Lunar New Year (end of January) would be a supportive catalyst for oil prices since the demand for petroleum products in China typically rises every year during that period.
Overall, the faster-than-expected shift in Covid policy means that the domestic fuel demand recovery could be larger than initially forecasted, boosting the expected China’s oil consumption to a record of nearly 16 million bpd in the end of 2023, up nearly a million from last year.
Robust global oil demand growth in 2023:
Our bullish outlook will be supported by an expected solid growth in global crude oil demand in 2023, of which 50% will be driven by a demand rebound from China.
Goldman Sachs expects global oil demand to grow by 2.7 million bpd until the end of the year, ING expects a growth by around 1.7 million bpd for the same period,
The International Energy Association (IEA) monthly Oil Market Report (OMR) lifted its 2023 oil demand growth forecast by 1.9 million bpd to 101.7 million bpd, an upgrade from its from 1.7 million bpd forecasted in December.
China reopening is driving the optimism over a supportive petroleum demand growth outlook on expectations that the half of the new global demand will come from China, as more people will start driving and traveling around the world.
The above table from OPEC indicates that most of the oil demand growth in 2023 will come from OECD regions (developed countries) due to a weak macroeconomic outlook, but it will come from the non-OECD regions (emerging markets), especially from China, Middle East, and India.
Tight supplies in 2023:
Russia will be a wild card on global oil supplies:
Russia’s invasion of Ukraine in late February 2022 shocked energy markets and the world economy. It has transformed oil, gas, and electricity markets, created 40-year record-high inflation, and triggered food insecurity while adding to the geopolitical landscape risk.
Western allies, including the Group of Seven (G7) major powers, the European Union, the UK, and Australia agreed to a $60/b price cap (banning Western companies from insuring, financing, or shipping Russian crude at above $60 a barrel) on Russian seaborne crude oil effective from December 05, 2022, over Moscow’s invasion of Ukraine.
Hence, the EU countries have separately implemented an embargo that prohibits them from purchasing seaborne Russian oil (Dec. 05, 2022) and oil refined products (Feb.05, 2023), aimed at paralyzing Russian state resources and Moscow’s military efforts in Ukraine.
In retaliation to the Western sanctions, Russian President Vladimir Putin banned the supply of crude oil and oil products from February 01, 2023, for five months to nations that abide by the cap.
Russia is the world’s second-largest oil exporter after Saudi Arabia with nearly 10 million barrels per day output, and a major disruption to its sales would have far-reaching consequences for global energy supplies into 2023.
However, we don’t expect the Western curbs on Russian crude sales to affect Moscow’s ability to sell the cargo in the global markets as there are plenty of countries such as China, India, and Turkey that are willing to buy the sanctioned oil in deep discounts, directly or through intermediaries. Russian Ural crude still flows to Chinese, Turkish, and Indian buyers (refiners) at below the G7’s $60/b price cap (on a range between $45-$59 a barrel).
OPEC+ pricing power:
In October 2022, the OPEC+ alliance slashed its collective output by 2 million bpd until the end of 2023 on concerns that a potential global economic slowdown could hit hard the global oil demand growth.
OPEC’s pricing power, and especially those of the de facto leader Saudi Arabia weighted significantly on the falling oil prices which had fallen as low as $70/b that time, suggesting that it put a “price limit” on the downside risks to our bullish oil forecast.
The group will still face challenges to keep oil markets higher in 2023 as most members might need to slash further the selling price of their oil benchmarks to lows not seen since 2021. The low prices would be necessary to maintain their barrels attractive for Asian customers amid persistent discounting on Russian oil after the G7 price cap of $60 per barrel on seaborne Russian crude, and the EU embargo on Russian oil exports following the Ukraine invasion.
Global economic downward pressure:
Recession fears are weighing on crude oil prices with the IMF-International Monetary Fund warning about a likely global recession in 2023 amid economic slowdowns in the world’s three main growth-driving regions of the United States, Europe, and China which could limit fuel demand.
The manufacturing activity has contracted around the world, especially in the industrial centres of Central Europe (Germany, France) and in the United States due to surging energy and raw material costs, while Chinese industrial activity shrank for a fifth straight month in December (reference link?) due to an unprecedented spike in coronavirus cases.
The 40-year record-high inflation numbers (reference link?) and the skyrocketing interest rates have damaged the purchasing power of the households (reference link?), and could next hit their consumption sentiment, which would eventually create a slowdown in global economic growth and hit hard the oil demand.
On top of that, we are concerned that the massive flow of Chinese travellers during the Lunar New Year season and students around the world could cause another surge in COVID infections at a time the global economies are still struggling with the energy crisis and inflation.
Central banks, inflation, and rate hikes:
We expect some of the major central banks such as the Federal Reserve, ECB, and BoE to temper their hawkish rhetoric and proceed with a slowing of interest rate hikes in the coming months amid growing signs that record-high inflation is easing.
Especially, the prospect of a less hawkish Federal Reserve, which weighs on the U.S. dollar, is expected to provide much relief to dollar-denominated crude oil prices, after a sharp rise in rates battered energy markets in 2022. A strong dollar makes the dollar-priced oil more expensive for buyers with foreign currency, and the opposite.
But given that inflation is still trending well above their annual target range of 2%, the policymakers are broadly expected to keep monetary policy tight until mid-2023, and will likely maintain high-interest rates for longer, before easing between end of the year and early 2024
The Federal Reserve policy terminal rate is currently expected to rise to a 5% to 5.25% range to bring higher inflation rates under control, nearly 1% higher than the current rate range of 4.25% to 4.5%. But persisting price pressures on high service fees and food costs will undermine the normalization to recovery.
Fresh inflation data during the next weeks will help central banks to decide whether they can slow the pace of interest rate hikes at their upcoming meetings, from staying the course of half a point to just a quarter-point increase instead of even larger hikes they used for most of 2022.
A weaker U.S. dollar ahead?
The U.S. dollar will be another wildcard for the dollar-denominated crude oil prices in the following months.
The greenback has tumbled in recent weeks on hopes that the Federal Reserve will hike interest rates at a slower pace in the near term amid increasing economic indications that U.S. inflation is easing.
Evidence of the latter include a falling Consumer Price Index and Producer Price Index, weaker retail sales, economic activity easing, labour market about to cool, a moderation in wage increases, and a further decline in new housing permits and starts.
The downtrend momentum of the greenback in December helped oil prices to rebound from their yearly lows of $70s/b to nearly $85/b, as the 2022’ dollar strength seems to have run out of steam due to a less hawkish Federal Reserve.
Closing Thoughts:
Despite the growing possibility of a global recession, a lower industrial and trade activity, high interest rates, and record-high inflation, we maintain our bullish outlook on crude oil prices for the Q1, 2023 driven by expectations for a sizeable rebound in oil demand in China, the resilience of the U.S. economy, a softer-than-expected global recession, and a weaker dollar.
Uncertainty in the crude oil market is always there, even when we do not realize it, but this year is different as it will come from some catalysts that were not easily anticipated a few years ago, including the Ukraine conflict, demand-supply imbalances, global recession concerns, the Covid pandemic management in China, and tightening monetary policies unwinding 15yrs of unprecedented quantitative easing accommodations and a behemoth money supply.
Market reaction in Q4, 2022:
Crude oil prices came under pressure in the last quarter of 2022, falling to levels not seen since before Russia’s invasion of Ukraine on February 24, 2022.
Brent dropped as low as $75/b and WTI to $70/b in early December, losing nearly 45% since topping at $140/b in early March, as sentiment was dented by growing concerns over a potential economic recession driven by rising interest rates due to a surging inflation, coupled with worries over rising Covid-19 cases in China.
Bullish Q1, 2023 Outlook:
Base scenario: Brent crude oil prices to trade on an average of $90/b in Q1, 2023
We remain bullish on the crude oil sector as we expect Brent (the benchmark for two thirds of the world’s oil) prices to trade on an average of $90 a barrel in the first quarter of the year based on the mismatch of the demand-supply oil dynamics.
We forecast a significant rebound in gasoline and jet fuel demand from the gradual reopening of Chinese economy (the world’s biggest crude importer), and a robust fuel demand growth from India, and North America over the course of next three months (according to OPEC), offsetting any weakening oil demand growth in Europe due to falling economic activity and recession fears.
Bullish scenario: Brent crude oil prices to break above the $100/b key psychological level
Our bullish case scenario assumes Brent oil prices to break above $100/b key psychological level and climb up to $110/b until the end of Q1, 2023 as global oil supply will not meet soaring demand.
The bullish scenario is based on the optimism over China’s move to reopen its borders for the first time in three years, a possible stronger-than-expected post-reopening economic recovery phase in China, the softening U.S. dollar, and the less aggressive increases to U.S. interest rates will boost the outlook for fuel demand and will overshadow global recession concerns.
Bearish scenario: Oil prices to break below the $70 a barrel key support level:
Our bearish scenario assumes Brent oil prices to break below $70/b key support level in case the global supply will outstrip a weakening demand.
The bearish scenario assumes of a lower-than-expected oil and energy consumption in case fresh Covid outbreak-flare-ups in China spread, Russian supply resilience amid a minimal impact of Western sanctions on Russian oil, a mild winter in the Northern Hemisphere, a persistent record-high inflation, and more aggressive rate hikes by central banks.
Market catalysts that impact the oil price dynamics:
China’s Covid policy U-turn:
In the energy universe, crude oil investors are always ultra-sensitive to anything that might happen in China, since the Asian dragon is the world’s largest petroleum-importing nation and second-largest consumer (after the USA).
China is preparing for a U-turn from its zero-Covid policy and the reopening of its economy and international borders after 2.5 years of isolation. The U-turn is raising hopes for a stronger-than-expected post-reopening economic recovery, as the country has been largely shut off from the world since the pandemic began in early 2020.
Hence, the relaxing of most anti-Covid measures, the reopening of its international borders, and the easing of Covid-related travel restrictions in 2023 will have a positive implication for global aviation, as the full recovery of China’s tourism and traveling for business and studying abroad will boost the demand for jet fuels and gasoline.
We also expect that the Lunar New Year (end of January) would be a supportive catalyst for oil prices since the demand for petroleum products in China typically rises every year during that period.
Overall, the faster-than-expected shift in Covid policy means that the domestic fuel demand recovery could be larger than initially forecasted, boosting the expected China’s oil consumption to a record of nearly 16 million bpd in the end of 2023, up nearly a million from last year.
Robust global oil demand growth in 2023:
Our bullish outlook will be supported by an expected solid growth in global crude oil demand in 2023, of which 50% will be driven by a demand rebound from China.
Goldman Sachs expects global oil demand to grow by 2.7 million bpd until the end of the year, ING expects a growth by around 1.7 million bpd for the same period,
The International Energy Association (IEA) monthly Oil Market Report (OMR) lifted its 2023 oil demand growth forecast by 1.9 million bpd to 101.7 million bpd, an upgrade from its from 1.7 million bpd forecasted in December.
China reopening is driving the optimism over a supportive petroleum demand growth outlook on expectations that the half of the new global demand will come from China, as more people will start driving and traveling around the world.
The above table from OPEC indicates that most of the oil demand growth in 2023 will come from OECD regions (developed countries) due to a weak macroeconomic outlook, but it will come from the non-OECD regions (emerging markets), especially from China, Middle East, and India.
Tight supplies in 2023:
Russia will be a wild card on global oil supplies:
Russia’s invasion of Ukraine in late February 2022 shocked energy markets and the world economy. It has transformed oil, gas, and electricity markets, created 40-year record-high inflation, and triggered food insecurity while adding to the geopolitical landscape risk.
Western allies, including the Group of Seven (G7) major powers, the European Union, the UK, and Australia agreed to a $60/b price cap (banning Western companies from insuring, financing, or shipping Russian crude at above $60 a barrel) on Russian seaborne crude oil effective from December 05, 2022, over Moscow’s invasion of Ukraine.
Hence, the EU countries have separately implemented an embargo that prohibits them from purchasing seaborne Russian oil (Dec. 05, 2022) and oil refined products (Feb.05, 2023), aimed at paralyzing Russian state resources and Moscow’s military efforts in Ukraine.
In retaliation to the Western sanctions, Russian President Vladimir Putin banned the supply of crude oil and oil products from February 01, 2023, for five months to nations that abide by the cap.
Russia is the world’s second-largest oil exporter after Saudi Arabia with nearly 10 million barrels per day output, and a major disruption to its sales would have far-reaching consequences for global energy supplies into 2023.
However, we don’t expect the Western curbs on Russian crude sales to affect Moscow’s ability to sell the cargo in the global markets as there are plenty of countries such as China, India, and Turkey that are willing to buy the sanctioned oil in deep discounts, directly or through intermediaries. Russian Ural crude still flows to Chinese, Turkish, and Indian buyers (refiners) at below the G7’s $60/b price cap (on a range between $45-$59 a barrel).
OPEC+ pricing power:
In October 2022, the OPEC+ alliance slashed its collective output by 2 million bpd until the end of 2023 on concerns that a potential global economic slowdown could hit hard the global oil demand growth.
OPEC’s pricing power, and especially those of the de facto leader Saudi Arabia weighted significantly on the falling oil prices which had fallen as low as $70/b that time, suggesting that it put a “price limit” on the downside risks to our bullish oil forecast.
The group will still face challenges to keep oil markets higher in 2023 as most members might need to slash further the selling price of their oil benchmarks to lows not seen since 2021. The low prices would be necessary to maintain their barrels attractive for Asian customers amid persistent discounting on Russian oil after the G7 price cap of $60 per barrel on seaborne Russian crude, and the EU embargo on Russian oil exports following the Ukraine invasion.
Global economic downward pressure:
Recession fears are weighing on crude oil prices with the IMF-International Monetary Fund warning about a likely global recession in 2023 amid economic slowdowns in the world’s three main growth-driving regions of the United States, Europe, and China which could limit fuel demand.
The manufacturing activity has contracted around the world, especially in the industrial centres of Central Europe (Germany, France) and in the United States due to surging energy and raw material costs, while Chinese industrial activity shrank for a fifth straight month in December (reference link?) due to an unprecedented spike in coronavirus cases.
The 40-year record-high inflation numbers (reference link?) and the skyrocketing interest rates have damaged the purchasing power of the households (reference link?), and could next hit their consumption sentiment, which would eventually create a slowdown in global economic growth and hit hard the oil demand.
On top of that, we are concerned that the massive flow of Chinese travellers during the Lunar New Year season and students around the world could cause another surge in COVID infections at a time the global economies are still struggling with the energy crisis and inflation.
Central banks, inflation, and rate hikes:
We expect some of the major central banks such as the Federal Reserve, ECB, and BoE to temper their hawkish rhetoric and proceed with a slowing of interest rate hikes in the coming months amid growing signs that record-high inflation is easing.
Especially, the prospect of a less hawkish Federal Reserve, which weighs on the U.S. dollar, is expected to provide much relief to dollar-denominated crude oil prices, after a sharp rise in rates battered energy markets in 2022. A strong dollar makes the dollar-priced oil more expensive for buyers with foreign currency, and the opposite.
But given that inflation is still trending well above their annual target range of 2%, the policymakers are broadly expected to keep monetary policy tight until mid-2023, and will likely maintain high-interest rates for longer, before easing between end of the year and early 2024
The Federal Reserve policy terminal rate is currently expected to rise to a 5% to 5.25% range to bring higher inflation rates under control, nearly 1% higher than the current rate range of 4.25% to 4.5%. But persisting price pressures on high service fees and food costs will undermine the normalization to recovery.
Fresh inflation data during the next weeks will help central banks to decide whether they can slow the pace of interest rate hikes at their upcoming meetings, from staying the course of half a point to just a quarter-point increase instead of even larger hikes they used for most of 2022.
A weaker U.S. dollar ahead?
The U.S. dollar will be another wildcard for the dollar-denominated crude oil prices in the following months.
The greenback has tumbled in recent weeks on hopes that the Federal Reserve will hike interest rates at a slower pace in the near term amid increasing economic indications that U.S. inflation is easing.
Evidence of the latter include a falling Consumer Price Index and Producer Price Index, weaker retail sales, economic activity easing, labour market about to cool, a moderation in wage increases, and a further decline in new housing permits and starts.
The downtrend momentum of the greenback in December helped oil prices to rebound from their yearly lows of $70s/b to nearly $85/b, as the 2022’ dollar strength seems to have run out of steam due to a less hawkish Federal Reserve.
Closing Thoughts:
Despite the growing possibility of a global recession, a lower industrial and trade activity, high interest rates, and record-high inflation, we maintain our bullish outlook on crude oil prices for the Q1, 2023 driven by expectations for a sizeable rebound in oil demand in China, the resilience of the U.S. economy, a softer-than-expected global recession, and a weaker dollar.
It’s possible the fossil fuel markets (crude oil, natural gas, coal) have never had a start of the year as uncertain as in 2023. We are still amidst a changing geopolitical, social, and economic environment that could impact the dynamics of the demand and supply equilibrium without so much changing or a product of the traditional price functions of demographic, rapid urbanizations, underinvestment, or technological advancement.
Uncertainty in the crude oil market is always there, even when we do not realize it, but this year is different as it will come from some catalysts that were not easily anticipated a few years ago, including the Ukraine conflict, demand-supply imbalances, global recession concerns, the Covid pandemic management in China, and tightening monetary policies unwinding 15yrs of unprecedented quantitative easing accommodations and a behemoth money supply.
Market reaction in Q4, 2022:
Crude oil prices came under pressure in the last quarter of 2022, falling to levels not seen since before Russia’s invasion of Ukraine on February 24, 2022.
Brent dropped as low as $75/b and WTI to $70/b in early December, losing nearly 45% since topping at $140/b in early March, as sentiment was dented by growing concerns over a potential economic recession driven by rising interest rates due to a surging inflation, coupled with worries over rising Covid-19 cases in China.
Bullish Q1, 2023 Outlook:
Base scenario: Brent crude oil prices to trade on an average of $90/b in Q1, 2023
We remain bullish on the crude oil sector as we expect Brent (the benchmark for two thirds of the world’s oil) prices to trade on an average of $90 a barrel in the first quarter of the year based on the mismatch of the demand-supply oil dynamics.
We forecast a significant rebound in gasoline and jet fuel demand from the gradual reopening of Chinese economy (the world’s biggest crude importer), and a robust fuel demand growth from India, and North America over the course of next three months (according to OPEC), offsetting any weakening oil demand growth in Europe due to falling economic activity and recession fears.
Bullish scenario: Brent crude oil prices to break above the $100/b key psychological level
Our bullish case scenario assumes Brent oil prices to break above $100/b key psychological level and climb up to $110/b until the end of Q1, 2023 as global oil supply will not meet soaring demand.
The bullish scenario is based on the optimism over China’s move to reopen its borders for the first time in three years, a possible stronger-than-expected post-reopening economic recovery phase in China, the softening U.S. dollar, and the less aggressive increases to U.S. interest rates will boost the outlook for fuel demand and will overshadow global recession concerns.
Bearish scenario: Oil prices to break below the $70 a barrel key support level:
Our bearish scenario assumes Brent oil prices to break below $70/b key support level in case the global supply will outstrip a weakening demand.
The bearish scenario assumes of a lower-than-expected oil and energy consumption in case fresh Covid outbreak-flare-ups in China spread, Russian supply resilience amid a minimal impact of Western sanctions on Russian oil, a mild winter in the Northern Hemisphere, a persistent record-high inflation, and more aggressive rate hikes by central banks.
Market catalysts that impact the oil price dynamics:
China’s Covid policy U-turn:
In the energy universe, crude oil investors are always ultra-sensitive to anything that might happen in China, since the Asian dragon is the world’s largest petroleum-importing nation and second-largest consumer (after the USA).
China is preparing for a U-turn from its zero-Covid policy and the reopening of its economy and international borders after 2.5 years of isolation. The U-turn is raising hopes for a stronger-than-expected post-reopening economic recovery, as the country has been largely shut off from the world since the pandemic began in early 2020.
Hence, the relaxing of most anti-Covid measures, the reopening of its international borders, and the easing of Covid-related travel restrictions in 2023 will have a positive implication for global aviation, as the full recovery of China’s tourism and traveling for business and studying abroad will boost the demand for jet fuels and gasoline.
We also expect that the Lunar New Year (end of January) would be a supportive catalyst for oil prices since the demand for petroleum products in China typically rises every year during that period.
Overall, the faster-than-expected shift in Covid policy means that the domestic fuel demand recovery could be larger than initially forecasted, boosting the expected China’s oil consumption to a record of nearly 16 million bpd in the end of 2023, up nearly a million from last year.
Robust global oil demand growth in 2023:
Our bullish outlook will be supported by an expected solid growth in global crude oil demand in 2023, of which 50% will be driven by a demand rebound from China.
Goldman Sachs expects global oil demand to grow by 2.7 million bpd until the end of the year, ING expects a growth by around 1.7 million bpd for the same period,
The International Energy Association (IEA) monthly Oil Market Report (OMR) lifted its 2023 oil demand growth forecast by 1.9 million bpd to 101.7 million bpd, an upgrade from its from 1.7 million bpd forecasted in December.
China reopening is driving the optimism over a supportive petroleum demand growth outlook on expectations that the half of the new global demand will come from China, as more people will start driving and traveling around the world.
The above table from OPEC indicates that most of the oil demand growth in 2023 will come from OECD regions (developed countries) due to a weak macroeconomic outlook, but it will come from the non-OECD regions (emerging markets), especially from China, Middle East, and India.
Tight supplies in 2023:
Russia will be a wild card on global oil supplies:
Russia’s invasion of Ukraine in late February 2022 shocked energy markets and the world economy. It has transformed oil, gas, and electricity markets, created 40-year record-high inflation, and triggered food insecurity while adding to the geopolitical landscape risk.
Western allies, including the Group of Seven (G7) major powers, the European Union, the UK, and Australia agreed to a $60/b price cap (banning Western companies from insuring, financing, or shipping Russian crude at above $60 a barrel) on Russian seaborne crude oil effective from December 05, 2022, over Moscow’s invasion of Ukraine.
Hence, the EU countries have separately implemented an embargo that prohibits them from purchasing seaborne Russian oil (Dec. 05, 2022) and oil refined products (Feb.05, 2023), aimed at paralyzing Russian state resources and Moscow’s military efforts in Ukraine.
In retaliation to the Western sanctions, Russian President Vladimir Putin banned the supply of crude oil and oil products from February 01, 2023, for five months to nations that abide by the cap.
Russia is the world’s second-largest oil exporter after Saudi Arabia with nearly 10 million barrels per day output, and a major disruption to its sales would have far-reaching consequences for global energy supplies into 2023.
However, we don’t expect the Western curbs on Russian crude sales to affect Moscow’s ability to sell the cargo in the global markets as there are plenty of countries such as China, India, and Turkey that are willing to buy the sanctioned oil in deep discounts, directly or through intermediaries. Russian Ural crude still flows to Chinese, Turkish, and Indian buyers (refiners) at below the G7’s $60/b price cap (on a range between $45-$59 a barrel).
OPEC+ pricing power:
In October 2022, the OPEC+ alliance slashed its collective output by 2 million bpd until the end of 2023 on concerns that a potential global economic slowdown could hit hard the global oil demand growth.
OPEC’s pricing power, and especially those of the de facto leader Saudi Arabia weighted significantly on the falling oil prices which had fallen as low as $70/b that time, suggesting that it put a “price limit” on the downside risks to our bullish oil forecast.
The group will still face challenges to keep oil markets higher in 2023 as most members might need to slash further the selling price of their oil benchmarks to lows not seen since 2021. The low prices would be necessary to maintain their barrels attractive for Asian customers amid persistent discounting on Russian oil after the G7 price cap of $60 per barrel on seaborne Russian crude, and the EU embargo on Russian oil exports following the Ukraine invasion.
Global economic downward pressure:
Recession fears are weighing on crude oil prices with the IMF-International Monetary Fund warning about a likely global recession in 2023 amid economic slowdowns in the world’s three main growth-driving regions of the United States, Europe, and China which could limit fuel demand.
The manufacturing activity has contracted around the world, especially in the industrial centres of Central Europe (Germany, France) and in the United States due to surging energy and raw material costs, while Chinese industrial activity shrank for a fifth straight month in December (reference link?) due to an unprecedented spike in coronavirus cases.
The 40-year record-high inflation numbers (reference link?) and the skyrocketing interest rates have damaged the purchasing power of the households (reference link?), and could next hit their consumption sentiment, which would eventually create a slowdown in global economic growth and hit hard the oil demand.
On top of that, we are concerned that the massive flow of Chinese travellers during the Lunar New Year season and students around the world could cause another surge in COVID infections at a time the global economies are still struggling with the energy crisis and inflation.
Central banks, inflation, and rate hikes:
We expect some of the major central banks such as the Federal Reserve, ECB, and BoE to temper their hawkish rhetoric and proceed with a slowing of interest rate hikes in the coming months amid growing signs that record-high inflation is easing.
Especially, the prospect of a less hawkish Federal Reserve, which weighs on the U.S. dollar, is expected to provide much relief to dollar-denominated crude oil prices, after a sharp rise in rates battered energy markets in 2022. A strong dollar makes the dollar-priced oil more expensive for buyers with foreign currency, and the opposite.
But given that inflation is still trending well above their annual target range of 2%, the policymakers are broadly expected to keep monetary policy tight until mid-2023, and will likely maintain high-interest rates for longer, before easing between end of the year and early 2024
The Federal Reserve policy terminal rate is currently expected to rise to a 5% to 5.25% range to bring higher inflation rates under control, nearly 1% higher than the current rate range of 4.25% to 4.5%. But persisting price pressures on high service fees and food costs will undermine the normalization to recovery.
Fresh inflation data during the next weeks will help central banks to decide whether they can slow the pace of interest rate hikes at their upcoming meetings, from staying the course of half a point to just a quarter-point increase instead of even larger hikes they used for most of 2022.
A weaker U.S. dollar ahead?
The U.S. dollar will be another wildcard for the dollar-denominated crude oil prices in the following months.
The greenback has tumbled in recent weeks on hopes that the Federal Reserve will hike interest rates at a slower pace in the near term amid increasing economic indications that U.S. inflation is easing.
Evidence of the latter include a falling Consumer Price Index and Producer Price Index, weaker retail sales, economic activity easing, labour market about to cool, a moderation in wage increases, and a further decline in new housing permits and starts.
The downtrend momentum of the greenback in December helped oil prices to rebound from their yearly lows of $70s/b to nearly $85/b, as the 2022’ dollar strength seems to have run out of steam due to a less hawkish Federal Reserve.
Closing Thoughts:
Despite the growing possibility of a global recession, a lower industrial and trade activity, high interest rates, and record-high inflation, we maintain our bullish outlook on crude oil prices for the Q1, 2023 driven by expectations for a sizeable rebound in oil demand in China, the resilience of the U.S. economy, a softer-than-expected global recession, and a weaker dollar.