2022 starting off to the downside

Just 1 week into 2022 and something interesting is happening. The rotation we have been witnessing for some time now has accelerated. While financial sites report a rotation from growth to value, I see it as an exodos from ultra-high valuation stocks to something else.

So far the S&P 500 has retreated by about 2.5%, the Wilshire 4500 index 4%, The Nasdaq 100 5.5%, but the ARKK innovation ETF has corrected by 13%. And that’s on top of the 25% slide in 2021.

Again, while the headlines point to the fact that this correction in growth stocks is the result of monetary policy, the truth is that it is probably more of a return to reality and investors becoming less complacent. Investors have been complacent for the past several years now, but at the end of the day valuation gravity always comes into play. And that is what I think is happening.

And the question is, what might happen if the mega-cap stocks start to fall also? Will that take down the entire market down or will the money flow to other names thus acting as a cushion at the index level?

Because if the rotation becomes a self-fulfilling prophecy, then eventually even mega caps will also correct, for no other reason than sentiment as opposed to anything wrong with their business. Remember we said Fed policy is probably a headwind in 2022. And while the mega cap stocks are not in bubble territory as many of the stocks that have correct by 80% recently, they are not cheap. Yes, there is the possibility that they could correct by 20% or more, and yes that will probably bring down the major indexes. But also keep in mind that just as many stocks corrected in 2021 with the major indexes up, many stocks can go up even as the major indexes go down.

Kazakhstan turmoil boosts Crude oil and Uranium prices

Crude oil prices gained 5% last week, posting their largest weekly gains since early December 2021, following the news that protests in Kazakhstan had temporarily disrupted oil production from the top oilfield Tengiz in the Caspian Sea.

Hence, oil prices received an additional boost after pipeline maintenance in Libya removed almost 750k bpd from the global markets. Libyan oil production recovered to nearly 1,3 million bpd after falling to zero amid the civil war in the previous decade.

President Kassym-Zhomart Tokayev has declared a state of emergency with a curfew and movement restrictions until January 19 in Kazakhstan, where protests have swept across the country, prompting the government to resign.

Kazakhstan riots disrupt crude oil production:

The international benchmark Brent crude topped $83/b and the U.S-based WTI contract climbed up to $80/b level on Friday as supply disruptions to the oil-rich Kazakhstan offset concerns over Omicron-led fuel demand slowdown.

Brent crude, Daily chart

Crude oil productions at Chevron-operated Tengiz oilfield, which has been the largest in the country with an approx. 700k barrel per day capacity was reduced last week after some local contractors disrupted train lines in support of anti-government protests.

Kazakhstan is a major oil producer with an output of about 1.9 million barrels per day in recent months, and a key member of the OPEC+ alliance led by Saudi Arabia and Russia, while it has rarely seen production disrupted by unrest or natural disaster.

Even though Tengiz’s production has been restored, Brent’s price remains well above $80/b at the beginning of the week, as energy traders worry about the fragility of the global crude supply amid the periodical disruptions in Libya, Nigeria, Iraq, Malaysia, Venezuela, Ecuador, and Angola.

Uranium prices surge on Kazakhstan unrest:

The instability in Kazakhstan threatens the output of nuclear fuel “Uranium” as well since the Central Asian country has been the world’s largest producer of radioactive metal, at a time the global supplies are becoming tighter.

Uranium prices rose sharply by 8% last week, climbing to as high as $45/pound, on concerns that riot-led transport disruptions might impact Kazakhstan to supply Uranium to global utility companies in the U.S, China, Japan, and elsewhere for nuclear power and energy power generation.

Kazakhstan is the world’s top uranium producer, accounting for around 40% of global supplies estimated at 50,000 tonnes a year.

Uranium contract, Weekly chart

Uranium price made a stunning comeback in 2021, doubling up in value as investors bet nuclear power will enjoy a renaissance as governments turn away from fossil fuels due to their green energy policies.

How has unrest started:

The demonstrations started in Kazakhstan’s oil-rich western region of Zhanaozen on January 02, 2022, with initial anger over the government’s decision to remove price caps for liquefied petroleum gas (LPG) butane and propane on New Year’s Day, which many Kazakhs use to fuel their LPG-converted vehicles because it’s cheaper than gasoline.

The unrest continued immediately to the main cities in the next days; with the anger expanding to wider unhappiness with the autocrat’s government over corruption, living standards, poverty, and unemployment in the resources-rich and former Soviet nation, all of which have worsened by the pandemic-led social and financial crisis.

The protestors clashed with police and security services, leading to the fire of many government buildings in major cities, while they also stormed capital Almaty’s airport, forcing Kazakhstan’s national airline, Air Astana, to cancel all flights until the situation stabilizes.

Dozens of police officers and protestors were reported killed and more than 1000 people injured because of the turmoil, with security forces reportedly firing on protesters and explosions being heard close to Republic Square in Almaty.

Russia’s and CSTO deployment in Kazakhstan

Russia and several former Soviet states including Belarus, Armenia, Kazakhstan, Uzbekistan, Kyrgyzstan, and Tajikistan, known as the CSTO security alliance (Collective Security Treaty Organization) have transferred military forces to Kazakhstan to help suppress the unrest and stabilize the situation under a CSTO decision.

Russia keeps very close relations with Kazakhstan as it uses the Baikonur Cosmodrome in the south of the country as the launch base for its crewed space missions, while around 20% of its 19 million population was ethnically Russian.

What may be the key drivers of market performance in 2022?

Investors are sharing their concerns whether the financial markets will continue to rise in the new year and to what degree, following a significant run-up in 2021, with inflation and monetary policies becoming the key themes for 2022.

Global markets ended the year to near records, led by the reopening stocks which were supported by the immense fiscal and monetary stimulus, the zero interest rates, and the robust corporate earnings.

However, it was the commodity sector that outperformed last year, with the prices of crude oil, natural gas, coal, and industrial metals skyrocketing to decades highs on strong demand and inflation hedging.

2022 starts with the same uncertainties, much like 2021, including but not limited to the impact that the highly mutated Omicron variant imposed on the economy, the ongoing supply disruptions, the battle with the record-high inflation rates, and the monetary decisions from policymakers.

Financial markets are waiving off a prolonged period of zero interest rates, which allowed economies and stocks to recover from the pandemic, leaving investors questioning wether the economy will be strong enough to withstand rate hikes.

The Federal Reserve and other major central banks are expected to hike interest rates multiple times and taper asset purchases in 2022, in response to surging inflation driven by pandemic stimulus programs.

European gas prices retreat 65% from records on milder weather and LNG supplies

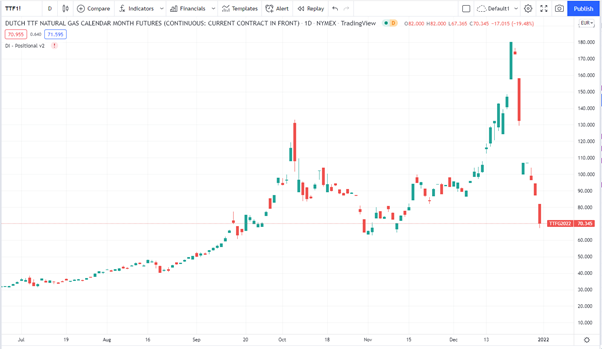
European wholesale natural gas prices kicked-off 2022 on the right foot, tumbling 20% to €67/MWh on Monday, as above the average mild winter temperatures in Europe, falling industrial demand, and surging LNG supplies to the region have helped offset the concerns over tight gas supplies from Russia.

Dutch TTF natural gas contract, Daily chart

Europe’s gas benchmark “Dutch TTF” front-month contract has dropped nearly 65% since topping at €188/MWh on Dec 21, 2021, falling in just 9 straight trading sessions, which it is the longest losing streak of losses in seven years.

Despite the fierce sell-off, European gas prices finished 2021 up by more than 300% (started around €20/MWh), increasing energy bills for households and industry across the continent and adding to inflationary pressures.

Surging LNG supplies weigh on Dutch TTF gas prices:

Energy investors increased bearish bets on European gas prices following the reports that several LNG – liquefied natural gas- cargoes were heading to gas-thirsty Europe while some other cargoes that were sailing to Asia had rerouted to the continent as well.

The arrival of a convoy of LNG tankers mainly from the U.S., Qatar, and North Africa to Europe at the end of 2021, which were attracted from record gas prices, pressed gas prices and eased the concerns over the low exports from Russia.

According to Reuters, Europe’s LNG imports for December 2021 are estimated at 9.1 million tonnes, the third-highest month ever, vs 6.2 million tonnes in December 2020, as physical gas traders cashed in on record prices.

Industrial shutdowns add pressure on gas prices:

The higher gas and electricity prices during the last quarter of 2021 forced many highly energy-consumed industries in Europe to halt or slow output, curbing demand for natural gas.

US industrial group Alcoa halted primary aluminium production at its San Ciprian smelter in Spain for two years due to high energy costs, while Norsk Hydro announced plans to cut capacity at a plant in Slovakia to around 60% of capacity.

Gas prices fall after abnormal warm weather in Europe:

The fundamentals got worse for European gas prices as the abnormal (for the time) warm weather across the continent decreased the demand for the heating fuel, allowing the European storages to be refilled at some point, sending the Dutch TTF gas prices into the deep red.

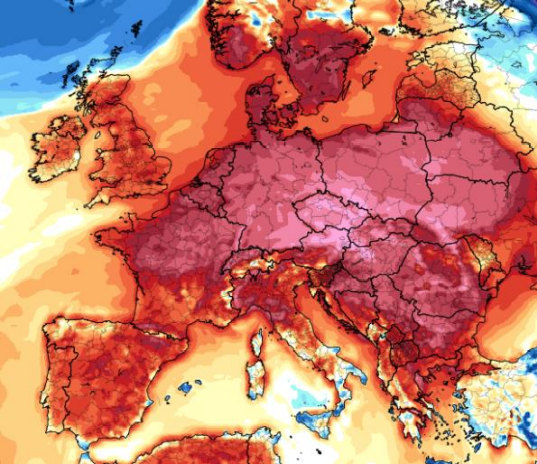
Warmer-than-normal weather in Europe

Northwest Europe had more than 10 degrees Celsius above average during the Christmas and New Year period, lowering the consumption of electricity for housing and offices heating, at a time when large volumes of LNG imports were starting to enter the grids.

Lower Russian gas exports to Europe:

Russia, the main gas supplier to Europe, has been reluctant to boost gas exports to customers in the continent through Ukraine, instead preferring to wait until the controversial undersea Nord Stream 2 gas pipeline is certificated from the German energy authority.

The key pipeline “Yamal-Europe” that usually delivers Russian gas to Western Europe was sending fuel back to Poland for a fourteenth day on Monday, Jan 03, 2022, deteriorating the gas tightness and keeping the storage levels at record lows.

A rebound ahead?

Energy traders expect global gas prices to recover in January if we see periods of cold weather in Europe or Asia in the remaining months of winter.

Hence, the ongoing Russia-Ukraine conflict could also push gas prices higher together with the lower-than-normal nuclear output in France (usually exports nuclear-led electricity) and Germany (shifts to renewable energy), and possible lower power generation from wind turbines in the North Sea due to milder weather.

2022 forecast

As we ended 2021, the talk of the town was inflation. While Central Banks, especially in the US, think inflation will eventually come down, the new language in “Fed-speak” does not encompass the term “transitory” anymore. The Fed is now a headwind for markets.

I must admit that I never prescribed to the narrative that growth stocks can expand their multiple to infinity just because we were in a low inflationary environment. In fact, many of the high-flying names over the past 2 years have given up most of their gains and in many cases are below where they were pre-covid. The ARK family of ETFs is just a small example, where the ARKK ETF is down by 25% for the year. Is the growth-stock model busted?

On the other hand, we have the mega-cap names that have not given up anything and are the primary the reason for the record highs at the Index level. Five companies alone (Apple, Microsoft, Alphabet, Amazon, and Facebook) are responsible for about 30% of the gains of the S&P 500 and nearly 50% for the Nasdaq 100. Is there a risk of high concentration, and might a different strategy be needed in 2022?


2022 themes

Possible Fed policy mistake

I think we can mostly agree that the biggest driver of market returns over the past 2 years has been Fed policy. If we agree on that, it also means a reverse of Fed policy might be the reason for a market correction.

According to the average consensus, the Fed will raise rates 2-3 times in 2022, 2023, 2024 and even once in 2025, bringing the Fed Funds rate to 2.5% – 2.75%. All this to “fight inflation”. While I am very doubtful the Fed will tighten as many think, let’s assume it does.

If the Fed does what the consensus believes, it is possible the US economy will enter recession. But even if we don’t get a recession, a slowdown of economic activity is most likely. Insofar as the market is concerned, it will probably react the same in both cases. In other words, the perception that the economy will weaken will probably be bad for equities even in the absence of a recession. Second, for the Fed to tighten as many believe, everything must go according to plan over the next 2-3 years including the absence of an exogenous event like COVID.

But the problem with higher US rates is not only the effect it might have on the US economy, but the effect on other currencies and other economies. While Turkey’s currency problems mostly have to do with politics, the same does not apply to other emerging markets.

Usually, the value of the dollar has nothing to do with traditional metrics by which other currencies are valued. This is why the US twin deficits (trade and current account) have never really affected its value. Also note that when the dollar is rising it usually means risk-off, and vice-versa when it weakens.

When the dollar goes up or down it is usually a function of the availability of dollars in the global economy. Because about 80% of global trade is conducted in dollars, a lack of dollars usually bids up its value, and an abundance of dollars the opposite. The point being is that the dollar does not adhere to the normal metrics used in other currencies.

Now by default, repo open market operations increase liquidity (temporarily increase the supply of reserve balances in the banking system), and reverse repo operations decrease liquidity.


The above chart depicts the value of the Fed’s reverse repo facility. Please note that as of the day of this writing there are about $1.7 trillion parked in this facility. Please also note $1.7 trillion is no small amount, it is the equivalent of about 2% of global GDP.

So, it might be the Fed has been tightening without realizing it. But even if it realizes it, paying 5 basis points of interest for reverse repos rather than having negative money market rates, might be the better of two evils.

While in theory repo operations have nothing to do with FX flows, and thus should not impact the value of the dollar, at the same time the fact that this dollar liquidity is trapped at the Fed might be a reason for dollar strength.

In any case, we will be following this facility in 2022 to see if our theories have any credence, and to see if we notice any change in the dollar (especially vs the EURUSD pair) as a result of the increase or decrease of this facility.

Now insofar as fighting inflation, the Fed must persuade markets and politicians that it knows what it is doing. The Fed can easily bring down inflation simply by crashing the economy with higher rates. The question is, is this the best policy? Is a recession worth bringing down inflation?

Personally, I doubt this is what the Fed wants. After all, why crash the economy only to lower interest rates again and increase asset purchases from the beginning? The Fed has a very difficult job ahead of it because markets are very sensitive to higher rates and conditioned to Central Bank liquidity.

Please recall that just 4 small hikes in 2018 were enough to crash markets and bring the US economy to a mini recession. This even before COVID. Today things are probably much worse, not to mention the fact that markets are conditioned to Central Bank liquidity and zero rates. Remember, we did not have monetary expansion in 2018, the Fed was shrinking its balance sheet, and rates were not at zero.

So, there is no playbook that the Fed can go by. This is why the current monetary situation is so difficult to navigate and prone to mistakes. Because if markets think they will not have Central Bank support, then there is the possibility of a sever correction that will most likely have a toll on the economy. Therefore, the Fed is skidding on thin ice; it’s a “dam if you do, dam if you don’t” type of situation.

My playbook of what the Fed might do is as follows. The Fed will continue to try to convince markets that it will tighten conditions to combat inflation, and it might raise rates 2-3 times, but no more than that. I honestly do not believe it will tighten conditions much more out of fear of what that might do to markets and the real economy. This despite having negative real rates for the foreseeable future. Between a recession and negative real rates, negative rates are the lesser of the two evils.

The risk of Extreme concentration in mega cap stocks

About 8 names are responsible for almost 30% of the market cap of the S&P 500, and the first 50 stocks are responsible for almost 50% of the market cap S&P 500 index. In other words, if the first 50 names go up 2% and the other 450 fall by 1%, the index will be up. This is exactly what has been happening for the past 12 months. And this is also the reason why active management has had such a hard time keeping up with index funds.

The question I have been asking myself over the past 12 months is what might happen if we see an exodos from mega cap stocks? Will money flow over to unloved sectors and deeply undervalued stocks, or will everything fall irrespective of the valuation of each individual name?

The risk, therefore, in 2022, is that we might see these mega-cap names being sold and bringing down the market at the index level. This is a real possibility, because it’s always the biggest and highest conviction stocks that fall last. While I am not making a call that the mega caps will correct in 2022, it is something to keep an eye on.


The above chart depicts the breath indicator for all stocks in the US above their 200-day moving average. As you can see, while the main indexes were going from record to record, breath indicators ,strong>were deteriorating the entire year. In fact, towards the end of the year in December, only about 1 out of 3 stocks were above their 200-day average. This is not indicative of a rising market.

It does not matter which breath indicator you look at; the common denominator is that most stocks in the US have been deteriorating all year while the main indexes were at new highs. Another example of how strange things have been this year can be found in a recent article in Blomberg (link here).

“Last week, when the S&P 500 closed at a 52-week high, 334 companies trading on the New York Stock Exchange hit a 52-week low, more than double the amount that marked new one-year highs. That’s happened only three other times in history — all of them in December 1999, according to Ramsey, who is chief investment officer for Leuthold Group.”

The so-called “stay at home stocks”, and many high-growth stocks have been dropping like a rock. High flying names like ROKU, DOCU, TDOC and many others too many to mention, are down as much as 80% from their February highs.

Will Mega-Cap stocks outperform in 2022, or will a different strategy be needed?

While we do not know what will happen in 2022, it is interesting to make some observations.


The above charts come from Yardeni research and offer some fascinating incite insofar as the forward multiple of US indexes.

While we do not know what will happen in 2022, it is interesting to make some observations.

While Index investing (AKA passive ETF investing) has been the main investment theme for several years, if you buy in an index fund today, you are paying the highest forward multiple on record, except for the 2000 dot com bubble period. On the other hand, small caps are the cheapest on record, with the exception of the 2008 financial crisis.

This does not mean that mega cap stocks will not rise in 2022, but it does mean that buying smaller companies might offer better returns. The same can be said for emerging markets as well.

Final thoughts

The S&P 500 finished for 2021 up 27%. This is the 3rd year of double-digit gains, the longest annual hot streak since 1999. This is a very difficult streak to beat even in the best of times. In addition, the Fed is officially a headwind for markets, and it is unknown if the dollar will strengthen in 2022 which might act as an additional headwind. On top of this COVID is still with us, and the major US indexes are the richest they have been in many years.

Yes, US markets could still rise in 2022, but it will not be easy, and everything must be smooth sailing, including the Fed not overdoing it by tightening too much.

On the plus side breath indicators in the US are starting from a low point, with small and mid-caps being a good value, which might indicate there is money to be made if the market does not repeat the extreme concentration into mega-caps of the past several years. In addition, emerging markets especially China might also be a good investment choice in 2022.