One of the ways central banks break the ice to markets is via their research. While said research is not the official opinion of any Central Bank, it is nevertheless an outcome that is likely to happen.
Research from the Federal Reserve Bank of NY (link here) suggests that a recession is almost certain. And I quote from their most recent blog post:
“The model’s outlook is considerably more pessimistic than it was in March. It projects inflation to remain elevated in 2022 at 3.8 percent, up a full percentage point relative to March, and to decline only gradually toward 2 percent thereafter (2.5 and 2.1 percent in 2023 and 2024, respectively).
This disinflation path is accompanied by a not-so-soft landing: the model predicts modestly negative GDP growth in both 2022 (-0.6 percent versus 0.9 percent in March) and 2023 (-0.5 percent versus 1.2 percent).
So, the NY Fed tells us to expect about 2 years of negative growth to the tune of about -0.6% and 0.5% for 2022 and 2023 respectively. This is a huge downward revision from just 1 month ago.
According to the model, the probability of a soft landing—defined as four-quarter GDP growth staying positive over the next ten quarters—is only about 10 percent.
Conversely, the chances of a hard landing—defined to include at least one quarter in the next ten in which four-quarter GDP growth dips below -1 percent, as occurred during the 1990 recession—are about 80 percent.”
So, not only is a soft landing unlikely, but a hard landing is almost a sure thing according to the NY Fed’s model. On the other hand, the Atlanta Fed’s GDPnow model (as of the date if this article) is forecasting 2nd quarter GDP lower about 1-2%.
The above wording confirms my suspicion that the US economy is in worse shape that what Mr. Powell is telling us, and that achieving a soft landing is far-fetched.
United States Michigan Consumer Sentiment

The above chart depicts consumer confidence in the US. Please note that the reading is at an all-time low. In fact, lower than the 2008 crisis and the 1980’s recessions. The Fed tells us that this is because of high inflation. While there is some truth to this, I suspect there is more to it.
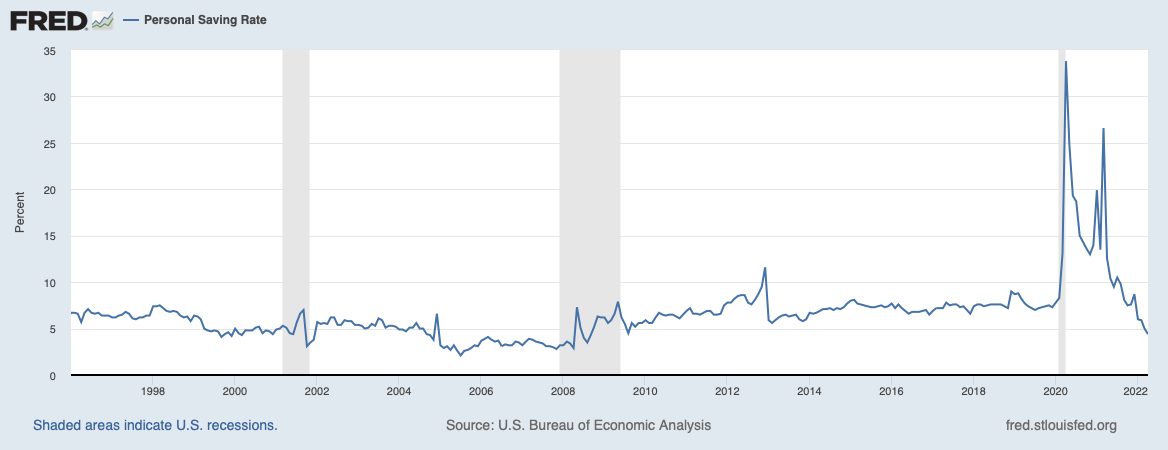
Now let’s look at some charts of the US consumer and the US economy that the Fed is about to technically crash. Personal saving levels during the pandemic have been depleted and are now back to 2013 levels.
The chart below depicts the Personal Savings rate defined as personal saving as a percentage of disposable personal income. As the charts shows, the personal Savings rate has returned to 2008 levels.
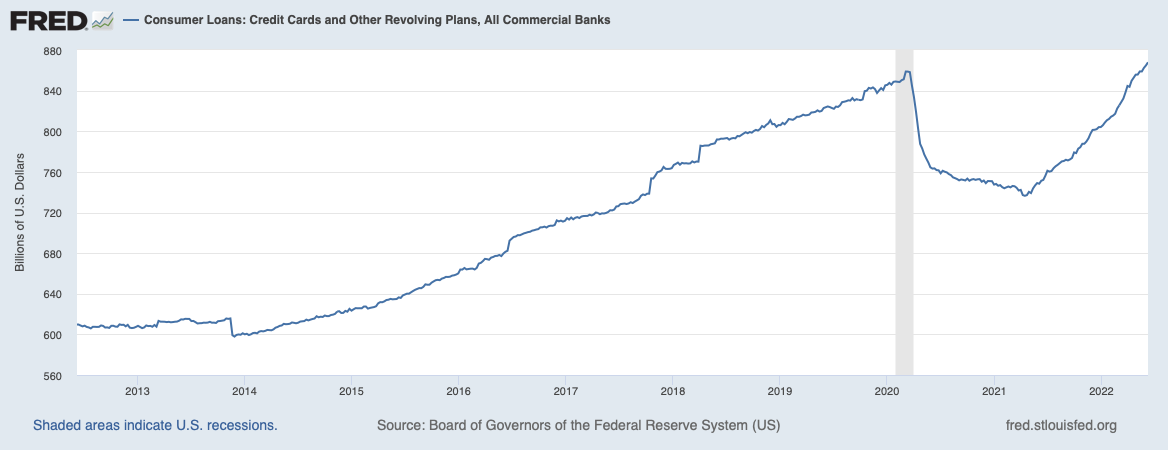
During the pandemic the talk of the town was that consumers used the free cash to pay off debt. While that was true for a while, today short-term consumer debt (mostly credit cards) is at a new high. Please note this debt carries a very high interest rates, that will only go higher as the Fed continues to raise rates.
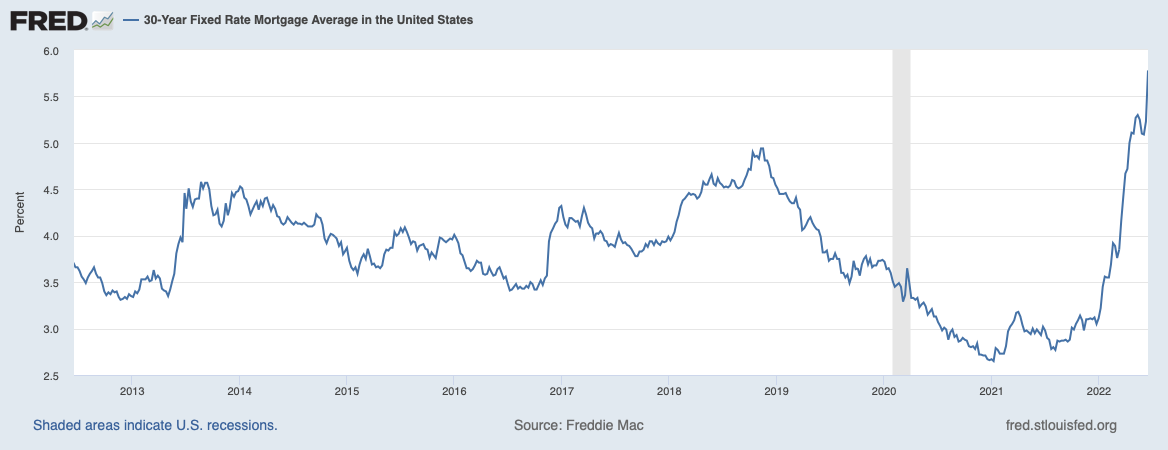
Finally, something else that will not help consumers is their mortgage payment. It’s amazing that the average 30-year fixed mortgage rate has almost about doubled over the past year.
The takeaway from the above charts is that consumers in the US are not as strong as the mainstream media would like us to believe. And in my opinion the Fed is making a huge gamble with its current policy, because like I said in previous posts, current inflationary pressures are not the result of monetary policy. The Fed can’t do anything about stopping a war, energy costs, and supply shocks because of the pandemic. Finally, the Fed has no control over politics (the tug of war between China and the US being an example).
However, politics being what they are, there is a lot of pressure from US politicians towards the Fed to do something about inflation. As such the Fed has decided to take the traditional stance of raising rates until the US economy breaks. And chances are the US is already in recession as many analysts think.
So, what will markets do?
As is well known, markets are forward looking. Meaning, what is priced-in today mostly reflects what markets think might happen in the future. As such, this also means that while the economy might still be sluggish, or be in a recession, it is possible for markets to bottom and even rally. But in order to call any kind of bottom, we must know where we stand insofar as what the market has priced in.
What has the market priced in?
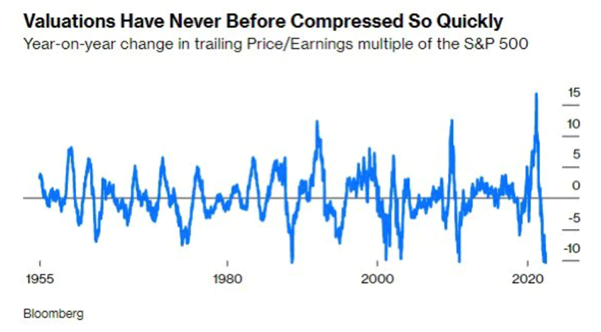
The truth is that the market has priced in a lot. The chart below from Bloomberg shows that we have witnessed the greatest and the fastest multiple compression ever.
Another way of looking at the multiple compression is the forward multiple of major US indexes.
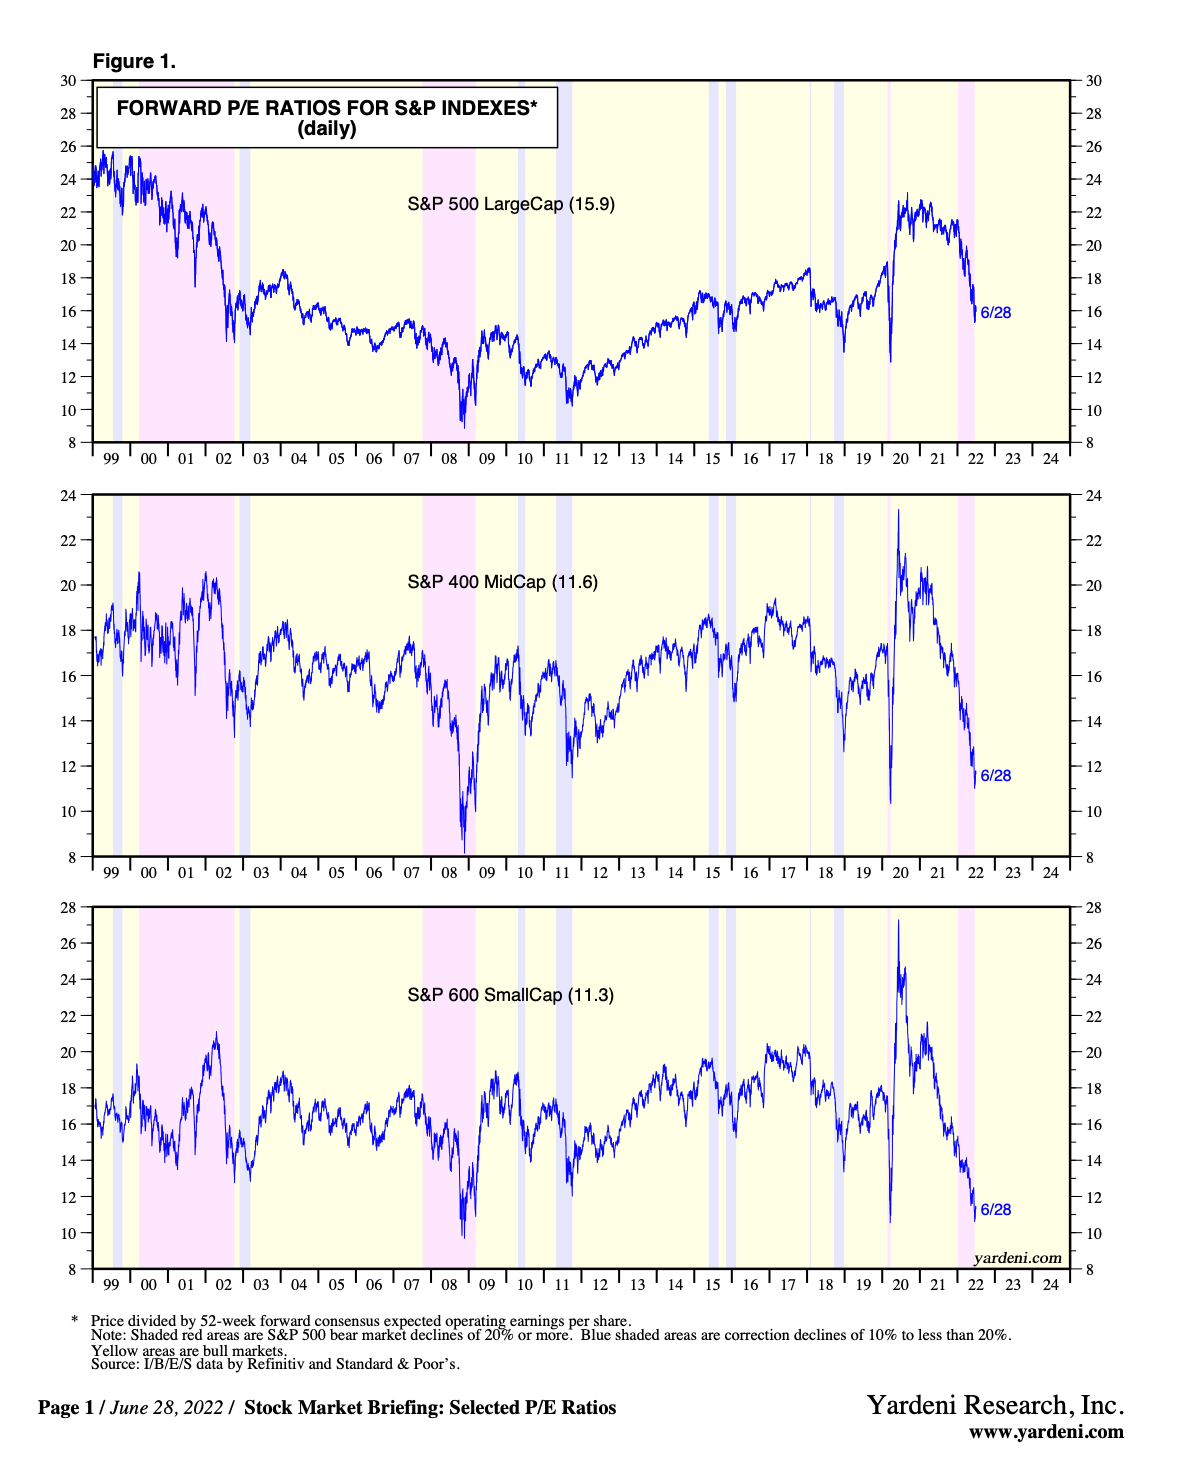
The above chart comes from Professor Yardeni and is indicative of the compression described above. The eyeopener is the S&P Small cap index that went from a forward multiple of 27 in 2020 to about 11 today.
With multiples down so much, one can make the case that current valuations are appropriate for building positions. The only variable we don’t know is how bad things might get as a result of the Fed’s monetary policy.
A multiple compression simply means equities have gone down. But if EPS estimates start to come down also, then equity prices might have further to go to the downside.
Inflation needs to be on a downward trajectory.
Inflation does not need to come down to 2% in order for markets to bottom or rally. All is needed are lower prints over the course of several months. Once this happens, I think inflation will not be a concern anymore. And while I think inflation has peaked, we need a confirmation of the trajectory.
Oil is by far the biggest component of current inflationary pressures. The problem is that the $30-$50 oil premium embedded in current prices (depending on who you ask) is also a function of the Russian-Ukraine conflict. Currently there is no way to determine when this conflict will end, or when oil production will increase, or when refining capacity will meet demand. As such inflation as a function of oil prices is a big unknown.
On the bright side inflation expectations, as measured by the 10-Year Breakeven Inflation rate at the St. Louis Fed’s site, shows expectations are coming down.
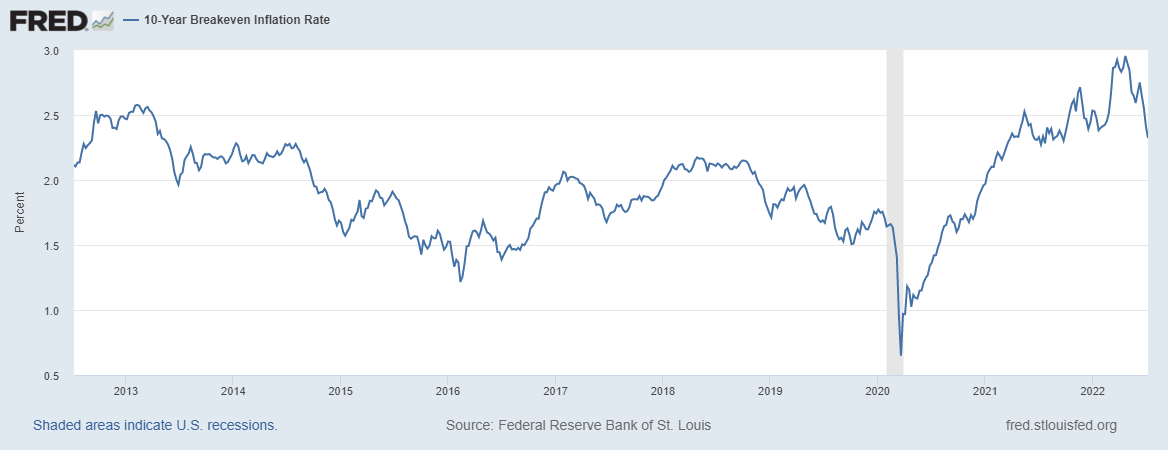
In fact, expectations are not that higher than in 2018, and overall are trending at about the average over the past decade.
Quantitative tightening
Perhaps the greatest headwind for markets is the contraction of the Fed’s balance sheet. This contraction goes by the code-name QT, or quantitative tightening. The Fed has stated it intends to reduce its balance sheet by about $2-3 trillion (some say even more). What this essentially means is that $2-3 trillion of illiquidity will disappear, cease to exist.
It is without a doubt that QE (quantitative easing) was responsible for some part of the market rally since the pandemic. I fact it is estimated the correlation between US markets and QE is about 0.92%. In other words, for every dollar of QE the market cap of US markets increased by 92 cents. Now that the Fed aims to reduce its balance sheet, it is likely that markets will be hard pressed against a shrinking liquidity pool. And because markets go to extremes, we might be in the middle of a multiple contraction that might surprise us.
The bottom line
The Fed has become extremely hawkish and aggressive in its monetary policy stance, with a total disregard for the US economy, but also the global economy. The strong dollar acts both as a headwind for US earnings (estimated to be about 8% lower because of the strong dollar), but also causes tightened financial conditions on a global scale. It is very hard to be bullish with such strong headwinds.
While current equity valuations are more than fair, if EPS estimates are revised downward, US and other major markets might have another leg down. So far EPS estimates have not changed, but the possibility of downward revisions are high.
However, at the end of the day what matters is what the Fed will do. If the Fed raises interest rates another 75 basis points, and then pauses, chances are that markets will stabilize or even rally. This despite the harsh economic reality of a recession in the US and Europe.
If on the other hand the Fed insists on raising rates much higher, as has been indicated by chairman Powell, then chances are that downward EPS revisions might take equities another leg down, and bonds will probably take another hit also.
As such, we continue to have a very defensive investment stance, characterized by very high cash levels, but being vigilant of opportunities as they arise. At the same time, we are closely following monetary policy which might give us clues if the US and Europe enter recession or not, and any change in monetary policy that might act as a catalyst for equities during the next quarter.
One of the ways central banks break the ice to markets is via their research. While said research is not the official opinion of any Central Bank, it is nevertheless an outcome that is likely to happen.
Research from the Federal Reserve Bank of NY (link here) suggests that a recession is almost certain. And I quote from their most recent blog post:
“The model’s outlook is considerably more pessimistic than it was in March. It projects inflation to remain elevated in 2022 at 3.8 percent, up a full percentage point relative to March, and to decline only gradually toward 2 percent thereafter (2.5 and 2.1 percent in 2023 and 2024, respectively).
This disinflation path is accompanied by a not-so-soft landing: the model predicts modestly negative GDP growth in both 2022 (-0.6 percent versus 0.9 percent in March) and 2023 (-0.5 percent versus 1.2 percent).
So, the NY Fed tells us to expect about 2 years of negative growth to the tune of about -0.6% and 0.5% for 2022 and 2023 respectively. This is a huge downward revision from just 1 month ago.
According to the model, the probability of a soft landing—defined as four-quarter GDP growth staying positive over the next ten quarters—is only about 10 percent.
Conversely, the chances of a hard landing—defined to include at least one quarter in the next ten in which four-quarter GDP growth dips below -1 percent, as occurred during the 1990 recession—are about 80 percent.”
So, not only is a soft landing unlikely, but a hard landing is almost a sure thing according to the NY Fed’s model. On the other hand, the Atlanta Fed’s GDPnow model (as of the date if this article) is forecasting 2nd quarter GDP lower about 1-2%.
The above wording confirms my suspicion that the US economy is in worse shape that what Mr. Powell is telling us, and that achieving a soft landing is far-fetched.
United States Michigan Consumer Sentiment
The above chart depicts consumer confidence in the US. Please note that the reading is at an all-time low. In fact, lower than the 2008 crisis and the 1980’s recessions. The Fed tells us that this is because of high inflation. While there is some truth to this, I suspect there is more to it.
Now let’s look at some charts of the US consumer and the US economy that the Fed is about to technically crash. Personal saving levels during the pandemic have been depleted and are now back to 2013 levels.
The chart below depicts the Personal Savings rate defined as personal saving as a percentage of disposable personal income. As the charts shows, the personal Savings rate has returned to 2008 levels.
During the pandemic the talk of the town was that consumers used the free cash to pay off debt. While that was true for a while, today short-term consumer debt (mostly credit cards) is at a new high. Please note this debt carries a very high interest rates, that will only go higher as the Fed continues to raise rates.
Finally, something else that will not help consumers is their mortgage payment. It’s amazing that the average 30-year fixed mortgage rate has almost about doubled over the past year.
The takeaway from the above charts is that consumers in the US are not as strong as the mainstream media would like us to believe. And in my opinion the Fed is making a huge gamble with its current policy, because like I said in previous posts, current inflationary pressures are not the result of monetary policy. The Fed can’t do anything about stopping a war, energy costs, and supply shocks because of the pandemic. Finally, the Fed has no control over politics (the tug of war between China and the US being an example).
However, politics being what they are, there is a lot of pressure from US politicians towards the Fed to do something about inflation. As such the Fed has decided to take the traditional stance of raising rates until the US economy breaks. And chances are the US is already in recession as many analysts think.
So, what will markets do?
As is well known, markets are forward looking. Meaning, what is priced-in today mostly reflects what markets think might happen in the future. As such, this also means that while the economy might still be sluggish, or be in a recession, it is possible for markets to bottom and even rally. But in order to call any kind of bottom, we must know where we stand insofar as what the market has priced in.
What has the market priced in?
The truth is that the market has priced in a lot. The chart below from Bloomberg shows that we have witnessed the greatest and the fastest multiple compression ever.
Another way of looking at the multiple compression is the forward multiple of major US indexes.
The above chart comes from Professor Yardeni and is indicative of the compression described above. The eyeopener is the S&P Small cap index that went from a forward multiple of 27 in 2020 to about 11 today.
With multiples down so much, one can make the case that current valuations are appropriate for building positions. The only variable we don’t know is how bad things might get as a result of the Fed’s monetary policy.
A multiple compression simply means equities have gone down. But if EPS estimates start to come down also, then equity prices might have further to go to the downside.
Inflation needs to be on a downward trajectory.
Inflation does not need to come down to 2% in order for markets to bottom or rally. All is needed are lower prints over the course of several months. Once this happens, I think inflation will not be a concern anymore. And while I think inflation has peaked, we need a confirmation of the trajectory.
Oil is by far the biggest component of current inflationary pressures. The problem is that the $30-$50 oil premium embedded in current prices (depending on who you ask) is also a function of the Russian-Ukraine conflict. Currently there is no way to determine when this conflict will end, or when oil production will increase, or when refining capacity will meet demand. As such inflation as a function of oil prices is a big unknown.
On the bright side inflation expectations, as measured by the 10-Year Breakeven Inflation rate at the St. Louis Fed’s site, shows expectations are coming down.
In fact, expectations are not that higher than in 2018, and overall are trending at about the average over the past decade.
Quantitative tightening
Perhaps the greatest headwind for markets is the contraction of the Fed’s balance sheet. This contraction goes by the code-name QT, or quantitative tightening. The Fed has stated it intends to reduce its balance sheet by about $2-3 trillion (some say even more). What this essentially means is that $2-3 trillion of illiquidity will disappear, cease to exist.
It is without a doubt that QE (quantitative easing) was responsible for some part of the market rally since the pandemic. I fact it is estimated the correlation between US markets and QE is about 0.92%. In other words, for every dollar of QE the market cap of US markets increased by 92 cents. Now that the Fed aims to reduce its balance sheet, it is likely that markets will be hard pressed against a shrinking liquidity pool. And because markets go to extremes, we might be in the middle of a multiple contraction that might surprise us.
The bottom line
The Fed has become extremely hawkish and aggressive in its monetary policy stance, with a total disregard for the US economy, but also the global economy. The strong dollar acts both as a headwind for US earnings (estimated to be about 8% lower because of the strong dollar), but also causes tightened financial conditions on a global scale. It is very hard to be bullish with such strong headwinds.
While current equity valuations are more than fair, if EPS estimates are revised downward, US and other major markets might have another leg down. So far EPS estimates have not changed, but the possibility of downward revisions are high.
However, at the end of the day what matters is what the Fed will do. If the Fed raises interest rates another 75 basis points, and then pauses, chances are that markets will stabilize or even rally. This despite the harsh economic reality of a recession in the US and Europe.
If on the other hand the Fed insists on raising rates much higher, as has been indicated by chairman Powell, then chances are that downward EPS revisions might take equities another leg down, and bonds will probably take another hit also.
As such, we continue to have a very defensive investment stance, characterized by very high cash levels, but being vigilant of opportunities as they arise. At the same time, we are closely following monetary policy which might give us clues if the US and Europe enter recession or not, and any change in monetary policy that might act as a catalyst for equities during the next quarter.