Bitcoin lost nearly 10% yesterday following the risk-off mood, coming off a 1-month high of $22,800 to the intraday lows of $19,900, while the world’s second-biggest digital coin Ethereum dropped 8% to below the $1,600 mark, despite the optimism around the well-awaited “Ethereum Merge” in the next days when the exchange will switch from a proof-of-work model to one that uses proof-of-stake.
Bitcoin lost nearly 10% yesterday following the risk-off mood, coming off a 1-month high of $22,800 to the intraday lows of $19,900, while the world’s second-biggest digital coin Ethereum dropped 8% to below the $1,600 mark, despite the optimism around the well-awaited “Ethereum Merge” in the next days when the exchange will switch from a proof-of-work model to one that uses proof-of-stake.
Asian-Pacific markets also closed in negative territory on Wednesday morning, with Japan’s Nikkei 225 and Hong Kong’s Hang Seng indices losing more than 2% following the overnight sell-off on Wall Street.
Bitcoin lost nearly 10% yesterday following the risk-off mood, coming off a 1-month high of $22,800 to the intraday lows of $19,900, while the world’s second-biggest digital coin Ethereum dropped 8% to below the $1,600 mark, despite the optimism around the well-awaited “Ethereum Merge” in the next days when the exchange will switch from a proof-of-work model to one that uses proof-of-stake.
Tuesday’s sell-off exceeded in magnitude the bearish trading sessions that occurred in May and June, with Dow Jones and S&P 500 standing just 5% and 8% respectively above their intraday low touched on June 17.
Asian-Pacific markets also closed in negative territory on Wednesday morning, with Japan’s Nikkei 225 and Hong Kong’s Hang Seng indices losing more than 2% following the overnight sell-off on Wall Street.
Bitcoin lost nearly 10% yesterday following the risk-off mood, coming off a 1-month high of $22,800 to the intraday lows of $19,900, while the world’s second-biggest digital coin Ethereum dropped 8% to below the $1,600 mark, despite the optimism around the well-awaited “Ethereum Merge” in the next days when the exchange will switch from a proof-of-work model to one that uses proof-of-stake.
The unexpected CPI figure triggered a massive selloff in risk assets like the high-leveraged tech stocks and cryptos, with Facebook-parent Meta, and the chip giant Nvidia plunging almost 10% and settling at the lows of the day.
Tuesday’s sell-off exceeded in magnitude the bearish trading sessions that occurred in May and June, with Dow Jones and S&P 500 standing just 5% and 8% respectively above their intraday low touched on June 17.
Asian-Pacific markets also closed in negative territory on Wednesday morning, with Japan’s Nikkei 225 and Hong Kong’s Hang Seng indices losing more than 2% following the overnight sell-off on Wall Street.
Bitcoin lost nearly 10% yesterday following the risk-off mood, coming off a 1-month high of $22,800 to the intraday lows of $19,900, while the world’s second-biggest digital coin Ethereum dropped 8% to below the $1,600 mark, despite the optimism around the well-awaited “Ethereum Merge” in the next days when the exchange will switch from a proof-of-work model to one that uses proof-of-stake.
Nasdaq Composite, 1-hour chart
The unexpected CPI figure triggered a massive selloff in risk assets like the high-leveraged tech stocks and cryptos, with Facebook-parent Meta, and the chip giant Nvidia plunging almost 10% and settling at the lows of the day.
Tuesday’s sell-off exceeded in magnitude the bearish trading sessions that occurred in May and June, with Dow Jones and S&P 500 standing just 5% and 8% respectively above their intraday low touched on June 17.
Asian-Pacific markets also closed in negative territory on Wednesday morning, with Japan’s Nikkei 225 and Hong Kong’s Hang Seng indices losing more than 2% following the overnight sell-off on Wall Street.
Bitcoin lost nearly 10% yesterday following the risk-off mood, coming off a 1-month high of $22,800 to the intraday lows of $19,900, while the world’s second-biggest digital coin Ethereum dropped 8% to below the $1,600 mark, despite the optimism around the well-awaited “Ethereum Merge” in the next days when the exchange will switch from a proof-of-work model to one that uses proof-of-stake.
The inflation-led risk aversion sentiment hit hard almost all the sectors across the board in the United States, with the industrial Dow Jones index losing almost 1,300 points or 4%, recording the worst day since June 2020, the S&P 500 losing more than 4%, while the tech-heavy Nasdaq Composite dropped more than 5%, as the higher dollar and yields hurt growth-sensitive tech stocks outlook.
Nasdaq Composite, 1-hour chart
The unexpected CPI figure triggered a massive selloff in risk assets like the high-leveraged tech stocks and cryptos, with Facebook-parent Meta, and the chip giant Nvidia plunging almost 10% and settling at the lows of the day.
Tuesday’s sell-off exceeded in magnitude the bearish trading sessions that occurred in May and June, with Dow Jones and S&P 500 standing just 5% and 8% respectively above their intraday low touched on June 17.
Asian-Pacific markets also closed in negative territory on Wednesday morning, with Japan’s Nikkei 225 and Hong Kong’s Hang Seng indices losing more than 2% following the overnight sell-off on Wall Street.
Bitcoin lost nearly 10% yesterday following the risk-off mood, coming off a 1-month high of $22,800 to the intraday lows of $19,900, while the world’s second-biggest digital coin Ethereum dropped 8% to below the $1,600 mark, despite the optimism around the well-awaited “Ethereum Merge” in the next days when the exchange will switch from a proof-of-work model to one that uses proof-of-stake.
Market reaction:
The inflation-led risk aversion sentiment hit hard almost all the sectors across the board in the United States, with the industrial Dow Jones index losing almost 1,300 points or 4%, recording the worst day since June 2020, the S&P 500 losing more than 4%, while the tech-heavy Nasdaq Composite dropped more than 5%, as the higher dollar and yields hurt growth-sensitive tech stocks outlook.
Nasdaq Composite, 1-hour chart
The unexpected CPI figure triggered a massive selloff in risk assets like the high-leveraged tech stocks and cryptos, with Facebook-parent Meta, and the chip giant Nvidia plunging almost 10% and settling at the lows of the day.
Tuesday’s sell-off exceeded in magnitude the bearish trading sessions that occurred in May and June, with Dow Jones and S&P 500 standing just 5% and 8% respectively above their intraday low touched on June 17.
Asian-Pacific markets also closed in negative territory on Wednesday morning, with Japan’s Nikkei 225 and Hong Kong’s Hang Seng indices losing more than 2% following the overnight sell-off on Wall Street.
Bitcoin lost nearly 10% yesterday following the risk-off mood, coming off a 1-month high of $22,800 to the intraday lows of $19,900, while the world’s second-biggest digital coin Ethereum dropped 8% to below the $1,600 mark, despite the optimism around the well-awaited “Ethereum Merge” in the next days when the exchange will switch from a proof-of-work model to one that uses proof-of-stake.
As result, both headline and core inflation prints came in above market expectations, reinforcing the fact that the Federal Reserve might deliver its third consecutive 0.75 percentage point rate hike at the next FOMC meeting scheduled on September 20-21, and to continue its aggressive hikes longer than some investors anticipated to combat high inflation.
Market reaction:
The inflation-led risk aversion sentiment hit hard almost all the sectors across the board in the United States, with the industrial Dow Jones index losing almost 1,300 points or 4%, recording the worst day since June 2020, the S&P 500 losing more than 4%, while the tech-heavy Nasdaq Composite dropped more than 5%, as the higher dollar and yields hurt growth-sensitive tech stocks outlook.
Nasdaq Composite, 1-hour chart
The unexpected CPI figure triggered a massive selloff in risk assets like the high-leveraged tech stocks and cryptos, with Facebook-parent Meta, and the chip giant Nvidia plunging almost 10% and settling at the lows of the day.
Tuesday’s sell-off exceeded in magnitude the bearish trading sessions that occurred in May and June, with Dow Jones and S&P 500 standing just 5% and 8% respectively above their intraday low touched on June 17.
Asian-Pacific markets also closed in negative territory on Wednesday morning, with Japan’s Nikkei 225 and Hong Kong’s Hang Seng indices losing more than 2% following the overnight sell-off on Wall Street.
Bitcoin lost nearly 10% yesterday following the risk-off mood, coming off a 1-month high of $22,800 to the intraday lows of $19,900, while the world’s second-biggest digital coin Ethereum dropped 8% to below the $1,600 mark, despite the optimism around the well-awaited “Ethereum Merge” in the next days when the exchange will switch from a proof-of-work model to one that uses proof-of-stake.
Yet, it was the jump in Core CPI reading that hurt investor optimism for cooling prices which would have led to a less aggressive Federal Reserve. Core CPI, which excludes volatile food and energy costs, rose 0.6% from July and 6.3% from August 2021.
As result, both headline and core inflation prints came in above market expectations, reinforcing the fact that the Federal Reserve might deliver its third consecutive 0.75 percentage point rate hike at the next FOMC meeting scheduled on September 20-21, and to continue its aggressive hikes longer than some investors anticipated to combat high inflation.
Market reaction:
The inflation-led risk aversion sentiment hit hard almost all the sectors across the board in the United States, with the industrial Dow Jones index losing almost 1,300 points or 4%, recording the worst day since June 2020, the S&P 500 losing more than 4%, while the tech-heavy Nasdaq Composite dropped more than 5%, as the higher dollar and yields hurt growth-sensitive tech stocks outlook.
Nasdaq Composite, 1-hour chart
The unexpected CPI figure triggered a massive selloff in risk assets like the high-leveraged tech stocks and cryptos, with Facebook-parent Meta, and the chip giant Nvidia plunging almost 10% and settling at the lows of the day.
Tuesday’s sell-off exceeded in magnitude the bearish trading sessions that occurred in May and June, with Dow Jones and S&P 500 standing just 5% and 8% respectively above their intraday low touched on June 17.
Asian-Pacific markets also closed in negative territory on Wednesday morning, with Japan’s Nikkei 225 and Hong Kong’s Hang Seng indices losing more than 2% following the overnight sell-off on Wall Street.
Bitcoin lost nearly 10% yesterday following the risk-off mood, coming off a 1-month high of $22,800 to the intraday lows of $19,900, while the world’s second-biggest digital coin Ethereum dropped 8% to below the $1,600 mark, despite the optimism around the well-awaited “Ethereum Merge” in the next days when the exchange will switch from a proof-of-work model to one that uses proof-of-stake.
According to the Bureau of Labor Statistics, the U.S. consumer price index (CPI) inflation rose by 0.1% for the month and 8.3% annually in August, even with a -10.6% decline in the gasoline index., challenging analysts’ outlooks that headline inflation would fall 0.1% month on month.
Yet, it was the jump in Core CPI reading that hurt investor optimism for cooling prices which would have led to a less aggressive Federal Reserve. Core CPI, which excludes volatile food and energy costs, rose 0.6% from July and 6.3% from August 2021.
As result, both headline and core inflation prints came in above market expectations, reinforcing the fact that the Federal Reserve might deliver its third consecutive 0.75 percentage point rate hike at the next FOMC meeting scheduled on September 20-21, and to continue its aggressive hikes longer than some investors anticipated to combat high inflation.
Market reaction:
The inflation-led risk aversion sentiment hit hard almost all the sectors across the board in the United States, with the industrial Dow Jones index losing almost 1,300 points or 4%, recording the worst day since June 2020, the S&P 500 losing more than 4%, while the tech-heavy Nasdaq Composite dropped more than 5%, as the higher dollar and yields hurt growth-sensitive tech stocks outlook.
Nasdaq Composite, 1-hour chart
The unexpected CPI figure triggered a massive selloff in risk assets like the high-leveraged tech stocks and cryptos, with Facebook-parent Meta, and the chip giant Nvidia plunging almost 10% and settling at the lows of the day.
Tuesday’s sell-off exceeded in magnitude the bearish trading sessions that occurred in May and June, with Dow Jones and S&P 500 standing just 5% and 8% respectively above their intraday low touched on June 17.
Asian-Pacific markets also closed in negative territory on Wednesday morning, with Japan’s Nikkei 225 and Hong Kong’s Hang Seng indices losing more than 2% following the overnight sell-off on Wall Street.
Bitcoin lost nearly 10% yesterday following the risk-off mood, coming off a 1-month high of $22,800 to the intraday lows of $19,900, while the world’s second-biggest digital coin Ethereum dropped 8% to below the $1,600 mark, despite the optimism around the well-awaited “Ethereum Merge” in the next days when the exchange will switch from a proof-of-work model to one that uses proof-of-stake.
Hotter CPI reading for August:
According to the Bureau of Labor Statistics, the U.S. consumer price index (CPI) inflation rose by 0.1% for the month and 8.3% annually in August, even with a -10.6% decline in the gasoline index., challenging analysts’ outlooks that headline inflation would fall 0.1% month on month.
Yet, it was the jump in Core CPI reading that hurt investor optimism for cooling prices which would have led to a less aggressive Federal Reserve. Core CPI, which excludes volatile food and energy costs, rose 0.6% from July and 6.3% from August 2021.
As result, both headline and core inflation prints came in above market expectations, reinforcing the fact that the Federal Reserve might deliver its third consecutive 0.75 percentage point rate hike at the next FOMC meeting scheduled on September 20-21, and to continue its aggressive hikes longer than some investors anticipated to combat high inflation.
Market reaction:
The inflation-led risk aversion sentiment hit hard almost all the sectors across the board in the United States, with the industrial Dow Jones index losing almost 1,300 points or 4%, recording the worst day since June 2020, the S&P 500 losing more than 4%, while the tech-heavy Nasdaq Composite dropped more than 5%, as the higher dollar and yields hurt growth-sensitive tech stocks outlook.
Nasdaq Composite, 1-hour chart
The unexpected CPI figure triggered a massive selloff in risk assets like the high-leveraged tech stocks and cryptos, with Facebook-parent Meta, and the chip giant Nvidia plunging almost 10% and settling at the lows of the day.
Tuesday’s sell-off exceeded in magnitude the bearish trading sessions that occurred in May and June, with Dow Jones and S&P 500 standing just 5% and 8% respectively above their intraday low touched on June 17.
Asian-Pacific markets also closed in negative territory on Wednesday morning, with Japan’s Nikkei 225 and Hong Kong’s Hang Seng indices losing more than 2% following the overnight sell-off on Wall Street.
Bitcoin lost nearly 10% yesterday following the risk-off mood, coming off a 1-month high of $22,800 to the intraday lows of $19,900, while the world’s second-biggest digital coin Ethereum dropped 8% to below the $1,600 mark, despite the optimism around the well-awaited “Ethereum Merge” in the next days when the exchange will switch from a proof-of-work model to one that uses proof-of-stake.
Global financial markets have dropped sharply as a hotter-than-expected U.S. inflation-CPI print for August fuels the speculation that the Federal Reserve will continue its aggressive policy of tightening monetary policy and hiking interest rates to curb soaring inflation.
Hotter CPI reading for August:
According to the Bureau of Labor Statistics, the U.S. consumer price index (CPI) inflation rose by 0.1% for the month and 8.3% annually in August, even with a -10.6% decline in the gasoline index., challenging analysts’ outlooks that headline inflation would fall 0.1% month on month.
Yet, it was the jump in Core CPI reading that hurt investor optimism for cooling prices which would have led to a less aggressive Federal Reserve. Core CPI, which excludes volatile food and energy costs, rose 0.6% from July and 6.3% from August 2021.
As result, both headline and core inflation prints came in above market expectations, reinforcing the fact that the Federal Reserve might deliver its third consecutive 0.75 percentage point rate hike at the next FOMC meeting scheduled on September 20-21, and to continue its aggressive hikes longer than some investors anticipated to combat high inflation.
Market reaction:
The inflation-led risk aversion sentiment hit hard almost all the sectors across the board in the United States, with the industrial Dow Jones index losing almost 1,300 points or 4%, recording the worst day since June 2020, the S&P 500 losing more than 4%, while the tech-heavy Nasdaq Composite dropped more than 5%, as the higher dollar and yields hurt growth-sensitive tech stocks outlook.
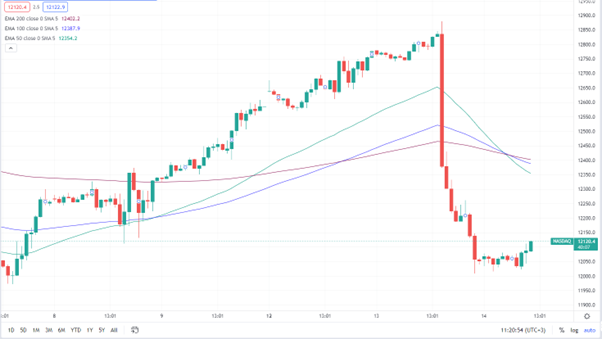
Nasdaq Composite, 1-hour chart
The unexpected CPI figure triggered a massive selloff in risk assets like the high-leveraged tech stocks and cryptos, with Facebook-parent Meta, and the chip giant Nvidia plunging almost 10% and settling at the lows of the day.
Tuesday’s sell-off exceeded in magnitude the bearish trading sessions that occurred in May and June, with Dow Jones and S&P 500 standing just 5% and 8% respectively above their intraday low touched on June 17.
Asian-Pacific markets also closed in negative territory on Wednesday morning, with Japan’s Nikkei 225 and Hong Kong’s Hang Seng indices losing more than 2% following the overnight sell-off on Wall Street.
Bitcoin lost nearly 10% yesterday following the risk-off mood, coming off a 1-month high of $22,800 to the intraday lows of $19,900, while the world’s second-biggest digital coin Ethereum dropped 8% to below the $1,600 mark, despite the optimism around the well-awaited “Ethereum Merge” in the next days when the exchange will switch from a proof-of-work model to one that uses proof-of-stake.